DDD is a graphical front-end for GDB and other command-line debuggers.
This is the First Edition of Debugging with DDD, 2000-01-03, for DDD Version 3.2.
Copyright © 2000 Universität Passau
Lehrstuhl für Software-Systeme
Innstraße 33
D-94032 Passau
GERMANY
Distributed by
Free Software Foundation, Inc.
59 Temple Place - Suite 330
Boston, MA 02111-1307
USA
DDD and this manual are available via the DDD WWW page.
Permission is granted to make and distribute verbatim copies of this manual provided the copyright notice and this permission notice are preserved on all copies.
Permission is granted to copy and distribute modified versions of this manual under the conditions for verbatim copying, provided also that the sections entitled "Copying" and "GNU General Public License" (see License) are included exactly as in the original, and provided that the entire resulting derived work is distributed under the terms of a permission notice identical to this one.
Permission is granted to copy and distribute translations of this manual into another language, under the above conditions for modified versions, except that this permission notice may be stated in a translation approved by the Free Software Foundation.
Send questions, comments, suggestions, etc. to ddd@gnu.org.
Send bug reports to bug-ddd@gnu.org.
The purpose of a debugger such as DDD is to allow you to see what is going on "inside" another program while it executes--or what another program was doing at the moment it crashed.
DDD can do four main kinds of things (plus other things in support of these) to help you catch bugs in the act:
Technically speaking, DDD is a front-end to a command-line debugger (called inferior debugger, because it lies at the layer beneath DDD). DDD supports the following inferior debuggers:
See Choosing an Inferior Debugger, for choosing the appropriate inferior debugger. See Sample Session, for getting a first impression of DDD.
This manual comes in several formats:
info program, or from
DDD via Help => DDD Manual.
The DDD source distribution
ddd-3.2.tar.gz contains this manual as
pre-formatted info files; you can also download them from
the DDD WWW page.
The DDD source distribution
ddd-3.2.tar.gz contains this manual as
pre-formatted PostScript file; you can also download it from
the DDD WWW page.
The DDD source distribution
ddd-3.2.tar.gz contains this manual as
pre-formatted PDF file; you can also download it from
the DDD WWW page.
A pre-formatted HTML version of this manual comes
in a separate DDD package
ddd-3.2-html-manual.tar.gz; you can browse
and download it via
the DDD WWW page.
The manual itself is written in TeXinfo format; its source code
ddd.texi is contained in the DDD source distribution
ddd-3.2.tar.gz.
The picture sources come in a separate package
ddd-3.2-pics.tar.gz; you need this package
only if you want to re-create the PostScript, HTML, or PDF versions.
DDD is free; this means that everyone is free to use it and free to redistribute it on a free basis. DDD is not in the public domain; it is copyrighted and there are restrictions on its distribution, but these restrictions are designed to permit everything that a good cooperating citizen would want to do. What is not allowed is to try to prevent others from further sharing any version of DDD that they might get from you. The precise conditions are found in the GNU General Public License that comes with DDD; See License, for details.
The easiest way to get a copy of DDD is from someone else who has it. You need not ask for permission to do so, or tell any one else; just copy it.
If you have access to the Internet, you can get the latest version of
DDD from the anonymous FTP server ftp.gnu.org in the
directory /gnu/ddd. This should contain the following files:
ddd-version.tar.gzddd-version-html-manual.tar.gzddd-version-pics.tar.gzDDD can also be found at numerous other archive sites around the
world; check the file ANNOUNCE in a DDD distribution for
the latest known list.
Dorothea Lütkehaus and Andreas Zeller were the original authors of
DDD. Many others have contributed to its development. The
files ChangeLog and THANKS in the DDD distribution
approximates a blow-by-blow account.
The history of DDD is a story of code recycling. The oldest parts of DDD were written in 1990, when Andreas Zeller designed VSL, a box-based visual structure language for visualizing data and program structures. The VSL interpreter and the Box library became part of Andreas' Diploma Thesis, a graphical syntax editor based on the Programming System Generator PSG.
In 1992, the VSL and Box libraries were recycled for the NORA project. For NORA, an experimental inference-based software development tool set, Andreas wrote a graph editor (based on VSL and the Box libraries) and facilities for inter-process knowledge exchange. Based on these tools, Dorothea Lütkehaus (now Dorothea Krabiell) realized DDD as her Diploma Thesis, 1994
The original DDD had no source window; this was added by Dorothea during the winter of 1994-1995. In the first quarter of 1995, finally, Andreas completed DDD by adding command and execution windows, extensions for DBX and remote debugging as well as configuration support for several architectures. Since then, Andreas has further maintained and extended DDD, based on the comments and suggestions of several DDD users around the world. See the comments in the DDD source for details.
Major DDD events:
You can use this manual at your leisure to read all about DDD. However, a handful of features are enough to get started using the debugger. This chapter illustrates those features.
The sample program sample.c (see Sample Program) exhibits the
following bug. Normally, sample should sort and print its
arguments numerically, as in the following example:
$ ./sample 8 7 5 4 1 3
1 3 4 5 7 8
However, with certain arguments, this goes wrong:
$ ./sample 8000 7000 5000 1000 4000
1000 1913 4000 5000 7000
Although the output is sorted and contains the right number of
arguments, some arguments are missing and replaced by bogus numbers;
here, 8000 is missing and replaced by
1913.3
Let us use DDD to see what is going on. First, you must compile
sample.c for debugging (see Compiling for Debugging), giving
the -g flag while compiling:
$ gcc -g -o sample sample.c
sample.c
Now, you can invoke DDD (see Invocation) on the
sample executable:
$ ddd sample
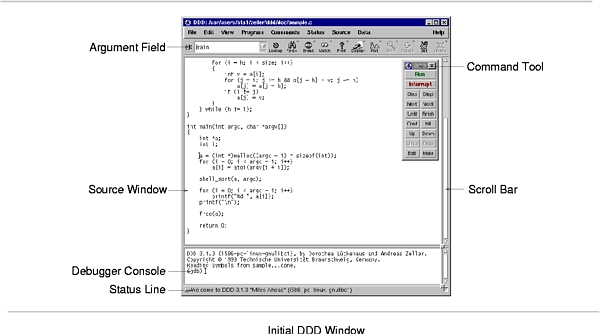
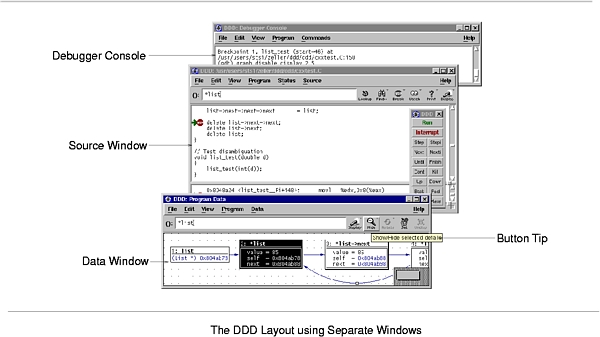
After a few seconds, DDD comes up. The Source Window
contains the source of your debugged program; use the Scroll Bar
to scroll through the file.
The Debugger Console (at the bottom) contains DDD version information as well as a GDB prompt.4
GNU DDD Version 3.2, by Dorothea Lütkehaus and Andreas Zeller.
Copyright © 1999 Technische Universität Braunschweig, Germany.
Copyright © 1999 Universität Passau, Germany.
Reading symbols from sample...done.
(gdb)
The first thing to do now is to place a Breakpoint
(see Breakpoints), making sample stop at a location you are
interested in. Click on the blank space left to the initialization of
a. The Argument field (): now contains the location
(sample.c:31). Now, click on Break to create a breakpoint
at the location in (). You see a little red stop sign appear in
line 31.
The next thing to do is to actually execute the program, such that
you can examine its behavior (see Running). Select Program
=> Run to execute the program; the Run Program dialog
appears.
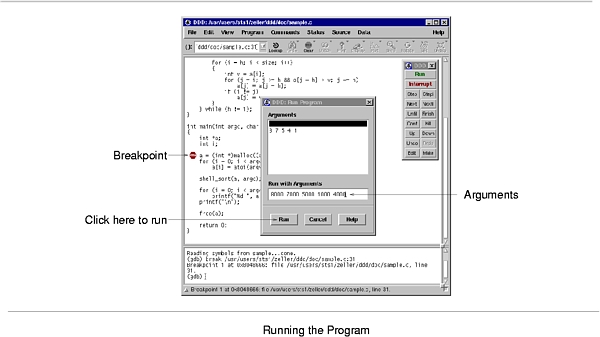
In Run with Arguments, you can now enter arguments for the
sample program. Enter the arguments resulting in erroneous
behavior here--that is, 8000 7000 5000 1000 4000. Click on
Run to start execution with the arguments you just entered.
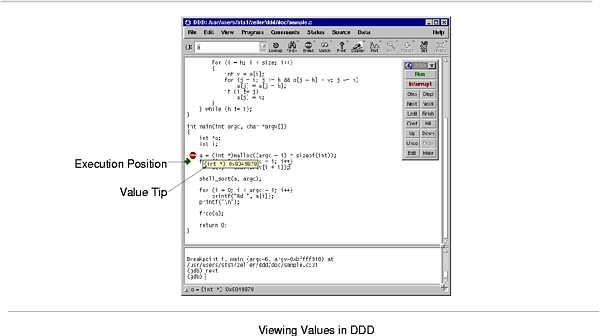
GDB now starts sample. Execution stops after a few moments as
the breakpoint is reached. This is reported in the debugger console.
(gdb) break sample.c:31
Breakpoint 1 at 0x8048666: file sample.c, line 31.
(gdb) run 8000 7000 5000 1000 4000
Starting program: sample 8000 7000 5000 1000 4000

Breakpoint 1, main (argc=6, argv=0xbffff918) at sample.c:31
(gdb)
The current execution line is indicated by a green arrow.
=> a = (int *)malloc((argc - 1) * sizeof(int));
You can now examine the variable values. To examine a simple variable,
you can simply move the mouse pointer on its name and leave it there.
After a second, a small window with the variable value pops up
(see Value Tips). Try this with argv to see its value
(6). The local variable a is not yet initialized; you'll
probably see 0x0 or some other invalid pointer value.
To execute the current line, click on the Next button on the
command tool. The arrow advances to the following line. Now, point
again on a to see that the value has changed and that a
has actually been initialized.
To examine the individual values of the a array, enter
a[0] in the argument field (you can clear it beforehand by
clicking on ():) and then click on the Print button. This
prints the current value of () in the debugger console
(see Printing Values). In our case, you'll get
(gdb) print a[0]
$1 = 0
(gdb)
or some other value (note that a has only been allocated, but the
contents have not yet been initialized).
To see all members of a at once, you must use a special GDB
operator. Since a has been allocated dynamically, GDB does not
know its size; you must specify it explicitly using the @
operator (see Array Slices). Enter a[0]@(argc - 1) in the
argument field and click on the Print button. You get the first
argc - 1 elements of a, or
(gdb) print a[0]@(argc - 1)
$2 = {0, 0, 0, 0, 0}
(gdb)
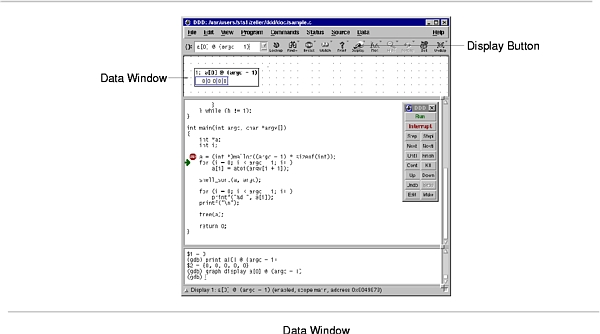
Rather than using Print at each stop to see the current value of
a, you can also display a, such that its is
automatically displayed. With a[0]@(argc - 1) still being shown
in the argument field, click on Display. The contents of
a are now shown in a new window, the Data Window. Click on
Rotate to rotate the array horizontally.
Now comes the assignment of a's members:
=>  for (i = 0; i < argc - 1; i++)
        a[i] = atoi(argv[i + 1]);
You can now click on Next and Next again to see how the
individual members of a are being assigned. Changed members are
highlighted.
To resume execution of the loop, use the Until button. This
makes GDB execute the program until a line greater than the current is
reached. Click on Until until you end at the call of
shell_sort in
=> shell_sort(a, argc);
At this point, a's contents should be 8000 7000 5000 1000
4000. Click again on Next to step over the call to
shell_sort. DDD ends in
=>  for (i = 0; i < argc - 1; i++)
        printf("%d ", a[i]);
and you see that after shell_sort has finished, the contents of
a are 1000, 1913, 4000, 5000, 7000--that is,
shell_sort has somehow garbled the contents of a.
To find out what has happened, execute the program once again. This
time, you do not skip through the initialization, but jump directly into
the shell_sort call. Delete the old breakpoint by selecting it
and clicking on Clear. Then, create a new breakpoint in line 35
before the call to shell_sort. To execute the program once
again, select Program => Run Again.
Once more, DDD ends up before the call to shell_sort:
=> shell_sort(a, argc);
This time, you want to examine closer what shell_sort is doing.
Click on Step to step into the call to shell_sort. This
leaves your program in the first executable line, or
=> int h = 1;
while the debugger console tells us the function just entered:
(gdb) step
shell_sort (a=0x8049878, size=6) at sample.c:9
(gdb)
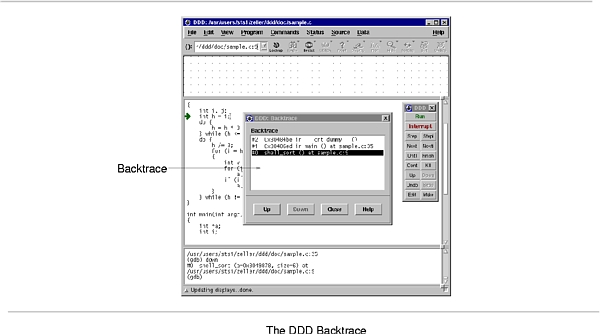
This output that shows the function where sample is now suspended
(and its arguments) is called a stack frame display. It shows a
summary of the stack. You can use Status => Backtrace to
see where you are in the stack as a whole; selecting a line (or clicking
on Up and Down) will let you move through the stack. Note
how the a display disappears when its frame is left.
Let us now check whether shell_sort's arguments are correct.
After returning to the lowest frame, enter a[0]@size in the
argument field and click on Print:
(gdb) print a[0] @ size
$4 = {8000, 7000, 5000, 1000, 4000, 1913}
(gdb)
Surprise! Where does this additional value 1913 come from? The
answer is simple: The array size as passed in size to
shell_sort is too large by one--1913 is a bogus
value which happens to reside in memory after a. And this last
value is being sorted in as well.
To see whether this is actually the problem cause, you can now assign
the correct value to size (see Assignment). Select
size in the source code and click on Set. A dialog pops
up where you can edit the variable value.
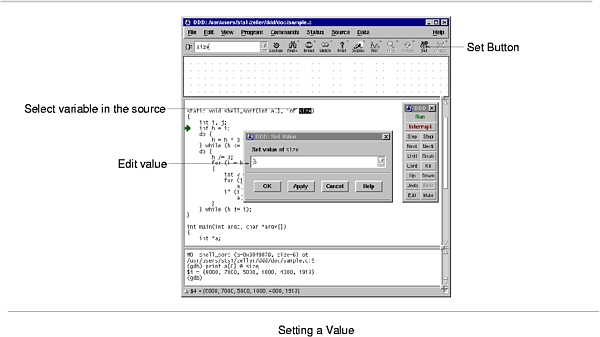
Change the value of size to 5 and click on OK.
Then, click on Finish to resume execution of the
shell_sort function:
(gdb) set variable size = 5
(gdb) finish
Run till exit from #0  shell_sort (a=0x8049878, size=5) at sample.c:9
0x80486ed in main (argc=6, argv=0xbffff918) at sample.c:35
(gdb)
Success! The a display now contains the correct values
1000, 4000, 5000, 7000, 8000.
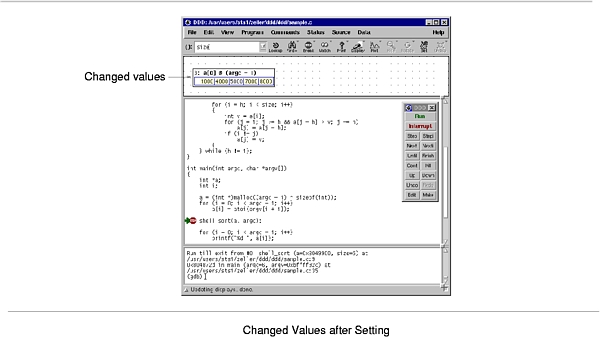
You can verify that these values are actually printed to standard output
by further executing the program. Click on Cont to continue
execution.
(gdb) cont
1000 4000 5000 7000 8000

Program exited normally.
(gdb)
The message Program exited normally. is from GDB; it indicates
that the sample program has finished executing.
Having found the problem cause, you can now fix the source code. Click
on Edit to edit sample.c, and change the line
shell_sort(a, argc);
to the correct invocation
shell_sort(a, argc - 1);
You can now recompile sample
$ gcc -g -o sample sample.c
and verify (via Program => Run Again) that sample
works fine now.
(gdb) run
`sample' has changed; re-reading symbols.
Reading in symbols...done.
Starting program: sample 8000 7000 5000 1000 4000
1000 4000 5000 7000 8000

Program exited normally.
(gdb)
All is done; the program works fine now. You can end this DDD
session with Program => Exit or Ctrl+Q.
Here's the source sample.c of the sample program.
/* sample.c -- Sample C program to be debugged with DDD */

#include <stdio.h>
#include <stdlib.h>

static void shell_sort(int a[], int size)
{
    int i, j;
    int h = 1;
    do {
        h = h * 3 + 1;
    } while (h <= size);
    do {
        h /= 3;
        for (i = h; i < size; i++)
        {
            int v = a[i];
            for (j = i; j >= h && a[j - h] > v; j -= h)
                a[j] = a[j - h];
            if (i != j)
                a[j] = v;
        }
    } while (h != 1);
}

int main(int argc, char *argv[])
{
    int *a;
    int i;

    a = (int *)malloc((argc - 1) * sizeof(int));
    for (i = 0; i < argc - 1; i++)
        a[i] = atoi(argv[i + 1]);

    shell_sort(a, argc);

    for (i = 0; i < argc - 1; i++)
        printf("%d ", a[i]);
    printf("\n");

    free(a);
    return 0;
}
This chapter discusses how to start DDD, and how to get out of it. The essentials are:
Normally, you can run DDD by invoking the program
ddd.
You can also run DDD with a variety of arguments and options, to specify more of your debugging environment at the outset.
The most usual way to start DDD is with one argument, specifying an executable program:
ddd program
If you use GDB, DBX, Ladebug, or XDB as inferior debuggers, you can also start with both an executable program and a core file specified:
ddd program core
You can, instead, specify a process ID as a second argument, if you want to debug a running process:
ddd program 1234
would attach DDD to process 1234 (unless you also have a file
named 1234; DDD does check for a core file first).
You can further control DDD by invoking it with specific options. To get a list of DDD options, invoke DDD as
ddd --help
Most important are the options to specify the inferior debugger (see Choosing an Inferior Debugger), but you can also customize several aspects of DDD upon invocation (see Options).
DDD also understands the usual X options such as -display
or -geometry. See X Options, for details.
All arguments and options that are not understood by DDD are
passed to the inferior debugger; See Inferior Debugger Options, for a
survey. To pass an option to the inferior debugger that conflicts with
an X option, or with a DDD option listed here, use the
--debugger option (see Options).
The most frequently required options are those to choose a specific inferior debugger.
Normally, the inferior debugger is determined by the program to analyze:
Use
ddd --jdb program
ddd --pydb program
ddd --perl program
to run DDD with JDB, PYDB, or Perl as inferior debugger.
Use
ddd --gdb program
ddd --dbx program
ddd --ladebug program
ddd --xdb program
to run DDD with GDB, DBX, Ladebug, or XDB as inferior debugger.
If you invoke DDD without any of these options, but give a program to analyze, then DDD will automatically determine the inferior debugger:
See Customizing Debugger Interaction, for more details on determining the inferior debugger.
You can further control how DDD starts up using the following
options. All options may be abbreviated, as long as they are
unambiguous; single dashes - instead of double dashes --
may also be used. Almost all options control a specific DDD
resource or resource class (see Customizing).
--attach-windows
Giving this option is equivalent to setting the DDD
Separate resource class to off. See Window Layout, for
details.
--attach-source-window
Giving this option is equivalent to setting the DDD
separateSourceWindow resource to off.
See Window Layout, for details.
--attach-data-window
Giving this option is equivalent to setting the DDD
separateDataWindow resource to off. See Window Layout,
for details.
--automatic-debugger
Giving this option is equivalent to setting the DDD
autoDebugger resource to on.
See Customizing Debugger Interaction, for details.
--button-tips
Giving this option is equivalent to setting the DDD
buttonTips resource to on. See Customizing Help, for
details.
--configuration
Giving this option is equivalent to setting the DDD
showConfiguration resource to on. See Diagnostics, for
details.
--check-configuration
Giving this option is equivalent to setting the DDD
checkConfiguration resource to on. See Diagnostics,
for details.
--data-window
Giving this option is equivalent to setting the DDD
openDataWindow resource to on. See Toggling Windows,
for details.
--dbx
Giving this option is equivalent to setting the DDD
debugger resource to dbx.
See Customizing Debugger Interaction, for details.
--debugger name
gdb, dbx, xdb,
jdb, pydb, or perl).
This option can also be used to pass options to the inferior debugger
that would otherwise conflict with DDD options. For instance,
to pass the option -d directory to XDB, use:
ddd --debugger "xdb -d directory"
If you use the --debugger option, be sure that the type of
inferior debugger is specified as well. That is, use one of the options
--gdb, --dbx, --xdb, --jdb, --pydb,
or --perl (unless the default setting works fine).
Giving this option is equivalent to setting the DDD
debuggerCommand resource to name. See Customizing Debugger Interaction, for details.
--debugger-console
Giving this option is equivalent to setting the DDD
openDebuggerConsole resource to on. See Toggling Windows, for details.
--disassemble
--no-disassemble
option, below.
Giving this option is equivalent to setting the DDD
disassemble resource to on. See Customizing Source,
for details.
--exec-window
Giving this option is equivalent to setting the DDD
separateExecWindow resource to on. See Customizing the Execution Window, for details.
--font fontname
-fn fontname
Giving this option is equivalent to setting the DDD
defaultFont resource to fontname. See Customizing Fonts, for details.
--fonts
Giving this option is equivalent to setting the DDD
showFonts resource to on. See Diagnostics, for
details.
--fontsize size
--fontsize 120.
Giving this option is equivalent to setting the DDD
FontSize resource class to size. See Customizing Fonts, for details.
--fullname
-f
-fullname format
suitable for debugger front-ends. By default, both the debugger console
and source window are disabled. See TTY mode, for a discussion.
Giving this option is equivalent to setting the DDD
TTYMode resource class to on. See TTY mode, for
details.
--gdb
Giving this option is equivalent to setting the DDD
debugger resource to gdb. See Customizing Debugger Interaction,
for details.
--glyphs
--no-glyphs option, below.
Giving this option is equivalent to setting the DDD
displayGlyphs resource to on. See Customizing Source,
for details.
--help
-h
-?
Giving this option is equivalent to setting the DDD
showInvocation resource to on. See Diagnostics, for
details.
--host hostname
--host username@hostname
--login option is not used,
use username as remote user name. See Remote Debugger, for
details.
Giving this option is equivalent to setting the DDD
debuggerHost resource to hostname. See Remote Debugger,
for details.
--jdb
Giving this option is equivalent to setting the DDD
debugger resource to gdb. See Customizing Debugger Interaction,
for details.
--ladebug
Giving this option is equivalent to setting the DDD
debugger resource to ladebug. See Customizing Debugger Interaction, for details.
--lesstif-hacks
--lesstif-version 999. Deprecated.
Giving this option is equivalent to setting the DDD
lessTifVersion resource to 999. See LessTif, for
details.
--lesstif-version version
Giving this option is equivalent to setting the DDD
lessTifVersion resource to version. See LessTif, for
details.
--license
Giving this option is equivalent to setting the DDD
showLicense resource to on. See Diagnostics, for
details.
--login username
-l username
Giving this option is equivalent to setting the DDD
debuggerHostLogin resource to username. See Remote Debugger, for details.
--maintenance
Maintenance menu with options for debugging
DDD. See Maintenance Menu, for details.
Giving this option is equivalent to setting the DDD
maintenance resource to on. See Maintenance Menu, for
details.
--manual
Giving this option is equivalent to setting the DDD
showManual resource to on. See Diagnostics, for
details.
--news
Giving this option is equivalent to setting the DDD
showNews resource to on. See Diagnostics, for details.
--no-button-tips
Giving this option is equivalent to setting the DDD
buttonTips resource to off. See Customizing Help, for
details.
--no-data-window
Giving this option is equivalent to setting the DDD
openDataWindow resource to off. See Toggling Windows,
for details.
--no-debugger-console
Giving this option is equivalent to setting the DDD
openDebuggerConsole resource to off. See Toggling Windows, for details.
--no-disassemble
Giving this option is equivalent to setting the DDD
disassemble resource to off. See Customizing Source,
for details.
--no-exec-window
Giving this option is equivalent to setting the DDD
separateExecWindow resource to off. See Customizing the Execution Window, for details.
--no-glyphs
Giving this option is equivalent to setting the DDD
displayGlyphs resource to off. See Customizing Source,
for details.
--no-lesstif-hacks
--lesstif-version 1000. Deprecated.
Giving this option is equivalent to setting the DDD
lessTifVersion resource to 1000. See LessTif, for
details.
--no-maintenance
Maintenance menu with options for
debugging DDD. This is the default. See Maintenance Menu,
for details.
Giving this option is equivalent to setting the DDD
maintenance resource to off. See Maintenance Menu, for
details.
--no-source-window
Giving this option is equivalent to setting the DDD
openSourceWindow resource to off. See Toggling Windows, for details.
--no-value-tips
Giving this option is equivalent to setting the DDD
valueTips resource to off. See Value Tips, for
details.
--nw
--perl
Giving this option is equivalent to setting the DDD
debugger resource to perl. See Customizing Debugger Interaction,
for details.
--pydb
Giving this option is equivalent to setting the DDD
debugger resource to pydb. See Customizing Debugger Interaction,
for details.
--panned-graph-editor
--scrolled-graph-editor, below.
Giving this option is equivalent to setting the DDD
pannedGraphEditor resource to on. See Customizing Displays, for details.
--play-log log-file
ddd --play-log log-file
invokes DDD as inferior debugger, simulating the inferior debugger given in log-file (see below). This is useful for debugging DDD.
Giving this option is equivalent to setting the DDD
playLog resource to on. See Customizing Debugger Interaction, for
details.
--PLAY log-file
$HOME/.ddd/log file as generated by some previous
DDD session (see Logging). When a command is entered, scan
log-file for this command and re-issue the logged reply; if the
command is not found, do nothing. This is used by the --play
option.
--rhost hostname
--rhost username@hostname
--login
option is not used, use username as remote user name.
See Remote Debugger, for details.
Giving this option is equivalent to setting the DDD
debuggerRHost resource to hostname. See Remote Debugger, for details.
--scrolled-graph-editor
--panned-graph-editor, above.
Giving this option is equivalent to setting the DDD
pannedGraphEditor resource to off. See Customizing Displays, for details.
--separate-windows
--separate
--attach options, above.
Giving this option is equivalent to setting the DDD
Separate resource class to off. See Window Layout, for
details.
--session session
Giving this option is equivalent to setting the DDD
session resource to session. See Resuming Sessions, for
details.
--source-window
Giving this option is equivalent to setting the DDD
openSourceWindow resource to on. See Toggling Windows,
for details.
--status-at-bottom
Giving this option is equivalent to setting the DDD
statusAtBottom resource to on. See Window Layout, for
details.
--status-at-top
Giving this option is equivalent to setting the DDD
statusAtBottom resource to off. See Window Layout, for
details.
--sync-debugger
Giving this option is equivalent to setting the DDD
synchronousDebugger resource to on. See Customizing Debugger Interaction, for details.
--toolbars-at-bottom
Giving this option is equivalent to setting the DDD
toolbarsAtBottom resource to on. See Window Layout,
for details.
--toolbars-at-top
Giving this option is equivalent to setting the DDD
toolbarsAtBottom resource to off. See Window Layout,
for details.
--trace
--trace is not specified, this information is written into
~/.ddd/log (~ stands for your home directory),
such that you can also do a post-mortem debugging. See Logging, for
details about logging.
Giving this option is equivalent to setting the DDD trace
resource to on. See Diagnostics, for details.
--tty
-t
Giving this option is equivalent to setting the DDD
ttyMode resource to on. See TTY mode, for details.
--value-tips
Giving this option is equivalent to setting the DDD
valueTips resource to on. See Value Tips, for details.
--version
-v
Giving this option is equivalent to setting the DDD
showVersion resource to on. See Diagnostics, for
details.
--vsl-library library
Giving this option is equivalent to setting the DDD
vslLibrary resource to library. See Customizing Display Appearance, for details.
--vsl-path path
Giving this option is equivalent to setting the DDD
vslPath resource to path. See Customizing Display Appearance, for details.
--vsl-help
--xdb
Giving this option is equivalent to setting the DDD
debugger resource to xdb. See Customizing Debugger Interaction, for details.
DDD also understands the following X options. Note that these
options only take a single dash -.
-display display
DISPLAY environment variable.
-geometry geometry
-iconic
-name name
-selectionTimeout timeout
-title name
-xrm resourcestring
All options that DDD does not recognize are passed to the inferior debugger. This section lists the most useful options of the different inferior debuggers supported by DDD.
These GDB options are useful when using DDD with GDB as inferior
debugger. Single dashes - instead of double dashes -- may
also be used.
-b baudrate
--cd dir
--command file
--core corefile
--directory dir
-d dir
--exec execfile
--mapped
--nx
-n
.gdbinit file.
--readnow
--se file
--symbols symfile
See Invoking GDB, for further options that can be used with GDB.
DBX variants differ widely in their options, so we cannot give a list here. Check out the dbx(1) and ladebug(1) manual pages.
These XDB options are useful when using DDD with XDB as inferior debugger.
-d dir
-P process-id
-l library
-l
ALL
means always pre-load shared library information.
-S num
-s
Further options can be found in the xdb(1) manual page.
The following JDB options are useful when using DDD with JDB as inferior debugger.
-host hostname
-password psswd
-debug)
These JDB options are forwarded to debuggee process:
-verbose
-v
-debug
-noasyncgc
-verbosegc
-noclassgc
-checksource
-cs
-ss number
-oss number
-ms number
-mx number
-Dname=value
-classpath path
-prof
-prof:file
./java.prof. If file is given,
write the data to ./file.
-verify
-verifyremote
-noverify
-dbgtrace
Further options can be found in the JDB documentation.
For a list of useful PYDB options, check out the PYDB documentation.
The most important Perl option to use with DDD is -w; it
enables several important warnings. For further options, see the
perlrun(1) manual page.
If you have multiple DDD instances running, they share common preferences and history files. This means that changes applied to one instance may get lost when being overwritten by the other instance. DDD has two means to protect you against unwanted losses. The first means is an automatic reloading of changed options, controlled by the following resource (see Customizing):
| checkOptions (class CheckOptions) | Resource |
Every n seconds, where n is the value of this resource,
DDD checks whether the options file has changed. Default is
30, which means that every 30 seconds, DDD checks for the
options file. Setting this resource to 0 disables checking for
changed option files.
|
Normally, automatic reloading of options should already suffice. If you
need stronger protection, DDD also provides a warning against
multiple instances. This warning is disabled by default, If you want to
be warned about multiple DDD invocations sharing the same
preferences and history files, enable Edit => Preferences
=> Warn if Multiple DDD Instances are Running.
This setting is tied to the following resource (see Customizing):
| warnIfLocked (class WarnIfLocked) | Resource |
Whether to warn if multiple DDD instances are running
(on) or not (off, default).
|
If you are bothered by X warnings, you can suppress them by setting
Edit => Preferences => General => Suppress X
warnings
.
This setting is tied to the following resource (see Customizing):
| suppressWarnings (class SuppressWarnings) | Resource |
If on, X warnings are suppressed. This is
sometimes useful for executables that were built on a machine with a
different X or Motif configuration. By default, this is
off.
|
To exit DDD, select File => Exit. You may also
type the quit command at the debugger prompt or press
<Ctrl+Q>. GDB and XDB also accept the q command or an
end-of-file character (usually <Ctrl+D>). Closing the last
DDD window will also exit DDD.
An interrupt (<ESC> or Interrupt) does not exit from
DDD, but rather terminates the action of any debugger command
that is in progress and returns to the debugger command level. It is
safe to type the interrupt character at any time because the debugger
does not allow it to take effect until a time when it is safe.
In case an ordinary interrupt does not succeed, you can also use an
abort (<Ctrl+\> or Abort), which sends a SIGABRT
signal to the inferior debugger. Use this in emergencies only; the
inferior debugger may be left inconsistent or even exit after a
SIGABRT signal.
As a last resort (if DDD hangs, for example), you may also
interrupt DDD itself using an interrupt signal (SIGINT).
This can be done by typing the interrupt character (usually
<Ctrl+C>) in the shell DDD was started from, or by using the
UNIX kill command. An interrupt signal interrupts any
DDD action; the inferior debugger is interrupted as well. Since
this interrupt signal can result in internal inconsistencies, use this
as a last resort in emergencies only; save your work as soon as possible
and restart DDD.
If you want to interrupt your current DDD session, you can save the entire the entire DDD state as session on disk and resume later.
To save a session, select File => Save Session As. You will
be asked for a symbolic session name session.
If your program is running (see Running), or if you have opened a core file (see Opening Core Dumps), DDD can also include a core file in the session such that the debuggee data will be restored when re-opening it. To get a core file, DDD typically must kill the debuggee. This means that you cannot resume program execution after saving a session. Depending on your architecture, other options for getting a core file may also be available.
Including a core dump is necessary for restoring memory contents and the
current execution position. To include a core dump, enable
Include Core Dump.
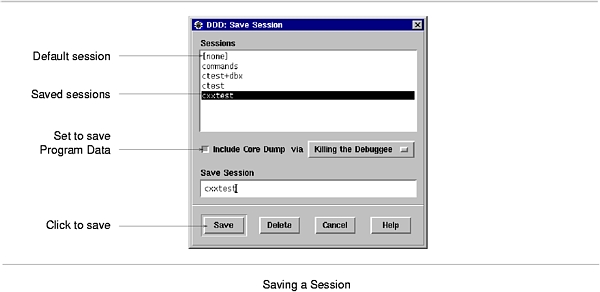
After clicking on Save, the session is saved in
~/.ddd/sessions/session.
Here's a list of the items whose state is saved in a session:
After saving the current state as a session, the session becomes active. This means that DDD state will be saved as session defaults:
~/.ddd/sessions/session/init instead of
~/.ddd/init. See Saving Options, for details.
~/.ddd/sessions/session/history instead of
~/.ddd/history. See Command History, for details.
To make the current session inactive, open the default session
named [None]. See Resuming Sessions, for details on opening
sessions.
To resume a previously saved session, select File => Open
Session and choose a session name from the list. After clicking on
Open, the entire DDD state will be restored from the
given session.
The session named [None] is the default session which is
active when starting DDD. To save options for default sessions,
open the default session and save options. See Saving Options, for
details.
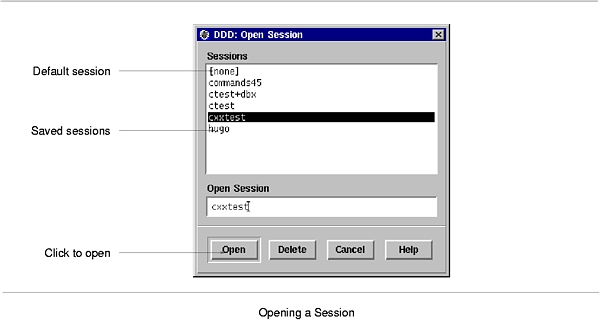
If a the restored session includes a core dump, the program being debugged will be in the same state at the time the session was saved; in particular, you can examine the program data. However, you will not be able to resume program execution since the process and its environment (open files, resources, etc.) no longer exist. However, you can restart the program, re-using the restored breakpoints and data displays.
Opening sessions also restores command definitions, buttons, display shortcuts and the source tab width. This way, you can maintain a different set of definitions for each session.
You can also specify a session to open when starting DDD. To invoke DDD with a session session, use
ddd --session session
There is also a shortcut that opens the session session and invokes the inferior debugger on an executable named session (in case session cannot be opened):
ddd =session
There is no need to give further command-line options when restarting a session, as they will be overridden by the options saved in the session.
You can also use an X session manager such as xsm to save and
restore DDD sessions.7 When
being shut down by a session manager, DDD saves its state under
the name specified by the session manager; resuming the X session makes
DDD reload its saved state.
To delete sessions that are no longer needed, select File
=> Open Session or File => Save Session. Select
the sessions you want to delete and click on Delete.
The default session [None] cannot be deleted.
You can change the place where DDD saves its sessions by setting
the environment variable DDD_SESSIONS to the name of a directory.
Default is ~/.ddd/sessions/.
Where applicable, DDD supports a gcore command to obtain
core files of the running program. You can enter its path via
Edit => Preferences => Helpers => Get Core
File
. Leave the value empty if you have no gcore or similar
command.
This setting is tied to the following resource (see Customizing):
| getCoreCommand (class GetCoreCommand) | Resource |
A command to get a core dump of a running process (typically,
gcore) @FILE@ is replaced by the base name of the file
to create; @PID@ is replaced by the process id. The output
must be written to @FILE@.@PID@.
Leave the value empty if you have no |
You can have each of DDD, the inferior debugger, and the debugged program run on different machines.
You can run DDD on a remote host, using your current host as X display. On the remote host, invoke DDD as
ddd -display display
where display is the name of the X server to connect to (for
instance, hostname:0.0, where hostname is your host).
Instead of specifying -display display, you can also set
the DISPLAY environment variable to display.
In order to run the inferior debugger on a remote host, you need
remsh (called rsh on BSD systems) access on the remote
host.
To run the debugger on a remote host hostname, invoke DDD as
ddd --host hostname remote-program
If your remote username differs from the local username, use
ddd --host hostname --login username remote-program
or
ddd --host username@hostname remote-program
instead.
There are a few caveats in remote mode:
--rhost option instead of --host. This
will invoke the remote debugger via an interactive shell on the remote
host, which may lead to better results.
Note: using --rhost, DDD invokes the inferior debugger as
soon as a shell prompt appears. The first output on the remote host
ending in a space character or > and not followed by a newline is
assumed to be a shell prompt. If necessary, adjust your shell prompt on
the remote host.
xterm terminal
emulator on the remote host, giving your current DISPLAY
environment variable as address. If the remote host cannot invoke
xterm, or does not have access to your X display, start
DDD with the --no-exec-window option. The program
input/output will then go through the DDD debugger console.
--trace option. This prints the shell commands issued by
DDD on standard error.
See Customizing Remote Debugging, for customizing remote mode.
When having the inferior debugger run on a remote host (see Remote Debugging), all commands to access the inferior debugger as well as its files must be run remotely. This is controlled by the following resources (see Customizing):
| rshCommand (class RshCommand) | Resource |
The remote shell command to invoke TTY-based commands on
remote hosts. Usually, remsh, rsh, ssh,
or on.
|
| listCoreCommand (class listCoreCommand) | Resource |
The command to list all core files on the remote host. The string
@MASK@ is replaced by a file filter. The default setting is:
Ddd*listCoreCommand: \ file @MASK@ | grep '.*:.*core.*' | cut -d: -f1 |
| listDirCommand (class listDirCommand) | Resource |
The command to list all directories on the remote host. The string
@MASK@ is replaced by a file filter. The default setting is:
Ddd*listDirCommand: \ file @MASK@ | grep '.*:.*directory.*' | cut -d: -f1 |
| listExecCommand (class listExecCommand) | Resource |
The command to list all executable files on the remote host. The string
@MASK@ is replaced by a file filter. The default setting is:
Ddd*listExecCommand: \ file @MASK@ | grep '.*:.*exec.*' \ | grep -v '.*:.*script.*' \ | cut -d: -f1 | grep -v '.*\.o$' |
| listSourceCommand (class listSourceCommand) | Resource |
The command to list all source files on the remote host. The string
@MASK@ is replaced by a file filter. The default setting is:
Ddd*listSourceCommand: \ file @MASK@ | grep '.*:.*text.*' | cut -d: -f1 |
The GDB debugger allows you to run the debugged program on a remote machine (called remote target), while GDB runs on the local machine.
See Remote, for details. Basically, the following steps are required:
gdbserver on the remote target.
file command.
gdbserver using the GDB target remote
command.
The local .gdbinit file is useful for setting up directory search
paths, etc.
Of course, you can also combine DDD remote mode and GDB remote mode, running DDD, GDB, and the debugged program each on a different machine.
These settings control the interaction of DDD with its inferior debugger.
To choose the default inferior debugger, select Edit =>
Preferences => Startup => Debugger Type. You can
Determine
Automatically from Arguments
to enable.
Debugger Type.
The following DDD resources control the invocation of the inferior debugger (see Customizing).
| autoDebugger (class AutoDebugger) | Resource |
If this is on (default), DDD will attempt to determine
the debugger type from its arguments, possibly overriding the
debugger resource (see below). If this is off,
DDD will invoke the debugger specified by the debugger
resource regardless of DDD arguments.
|
| debugger (class Debugger) | Resource |
The type of the inferior debugger to invoke (gdb, dbx,
ladebug, xdb, jdb, pydb, or perl).
This resource is usually set through the |
| debuggerCommand (class DebuggerCommand) | Resource |
The name under which the inferior debugger is to be invoked. If this
string is empty (default), the debugger type (debugger resource)
is used.
This resource is usually set through the |
DDD uses a number of resources to initialize the inferior debugger (see Customizing).
| gdbInitCommands (class InitCommands) | Resource |
This string contains a list of newline-separated commands that are
initially sent to GDB. As a side-effect, all settings
specified in this resource are considered fixed and cannot be changed
through the GDB settings panel, unless preceded by white
space. By default, the gdbInitCommands resource contains some
settings vital to DDD:
  Ddd*gdbInitCommands: \
  set height 0\n\
  set width 0\n\
   set verbose off\n\
  set prompt (gdb) \n
While the Do not use this resource to customize GDB; instead, use a
personal |
| gdbSettings (class Settings) | Resource |
This string contains a list of newline-separated commands that are
also initially sent to GDB. Its default value is
  Ddd*gdbSettings: \
  set print asm-demangle on\n
This resource is used to save and restore the debugger settings. |
| sourceInitCommands (class SourceInitCommands) | Resource |
If on (default), DDD writes all GDB initialization
commands into a temporary file and makes GDB read this file, rather than
sending each initialization command separately. This results in faster
startup (especially if you have several user-defined commands). If
off, DDD makes GDB process each command separately.
|
| dbxInitCommands (class InitCommands) | Resource |
|
This string contains a list of newline-separated commands that are
initially sent to DBX. By default, it is empty.
Do not use this resource to customize DBX; instead, use a
personal |
| dbxSettings (class Settings) | Resource |
| This string contains a list of newline-separated commands that are also initially sent to DBX. By default, it is empty. |
| xdbInitCommands (class InitCommands) | Resource |
|
This string contains a list of newline-separated commands that are
initially sent to XDB. By default, it is empty.
Do not use this resource to customize DBX; instead, use a
personal |
| xdbSettings (class Settings) | Resource |
| This string contains a list of newline-separated commands that are also initially sent to XDB. By default, it is empty. |
| jdbInitCommands (class InitCommands) | Resource |
| This string contains a list of newline-separated commands that are initially sent to JDB. This resource may be used to customize JDB. By default, it is empty. |
| jdbSettings (class Settings) | Resource |
|
This string contains a list of newline-separated commands that are
also initially sent to JDB. By default, it is empty.
This resource is used by DDD to save and restore JDB settings. |
| pydbInitCommands (class InitCommands) | Resource |
|
This string contains a list of newline-separated commands that are
initially sent to PYDB. By default, it is empty.
This resource may be used to customize PYDB. |
| pydbSettings (class Settings) | Resource |
|
This string contains a list of newline-separated commands that are
also initially sent to PYDB. By default, it is empty.
This resource is used by DDD to save and restore PYDB settings. |
| perlInitCommands (class InitCommands) | Resource |
|
This string contains a list of newline-separated commands that are
initially sent to the Perl debugger. By default, it is empty.
This resource may be used to customize the Perl debugger. |
| perlSettings (class Settings) | Resource |
|
This string contains a list of newline-separated commands that are
also initially sent to the Perl debugger. By default, it is empty.
This resource is used by DDD to save and restore Perl debugger settings. |
| openSelection (class OpenSelection) | Resource |
If this is on, DDD invoked without argument checks
whether the current selection or clipboard contains the file name or
URL of an executable program. If this is so, DDD
will automatically open this program for debugging. If this resource
is off (default), DDD invoked without arguments will
always start without a debugged program.
|
The following resources control the communication with the inferior debugger.
| blockTTYInput (class BlockTTYInput) | Resource |
Whether DDD should block when reading data from the inferior debugger
via the pseudo-tty interface. Most UNIX systems except GNU/Linux
require this; set it to on. On GNU/Linux, set it to
off. The value auto (default) will always select the
"best" choice (that is, the best choice known to the DDD
developers).
|
| displayTimeout (class DisplayTimeout) | Resource |
The time (in ms) to wait for the inferior debugger to finish a partial
display information. Default is 2000.
|
| positionTimeout (class PositionTimeout) | Resource |
The time (in ms) to wait for the inferior debugger to finish a partial
position information. Default is 500.
|
| questionTimeout (class QuestionTimeout) | Resource |
The time (in seconds) to wait for the inferior debugger to reply.
Default is 10.
|
| synchronousDebugger (class SynchronousDebugger) | Resource |
If on, X events are not processed while the debugger is busy.
This may result in slightly better performance on single-processor
systems. See Options, for the --sync-debugger option.
|
| terminateOnEOF (class TerminateOnEOF) | Resource |
If on, DDD terminates the inferior debugger when
DDD detects an EOF condition (that is, as soon as the inferior
debugger closes its output channel). This was the default behavior in
DDD 2.x and earlier. If off (default), DDD takes
no special action.
|
| useTTYCommand (class UseTTYCommand) | Resource |
If on, use the GDB tty command for redirecting
input/output to the separate execution window. If off, use
explicit redirection through shell redirection operators < and
>. The default is off (explicit redirection), since on
some systems, the tty command does not work properly on some
GDB versions.
|
DDD is composed of three main windows. From top to bottom, we have:
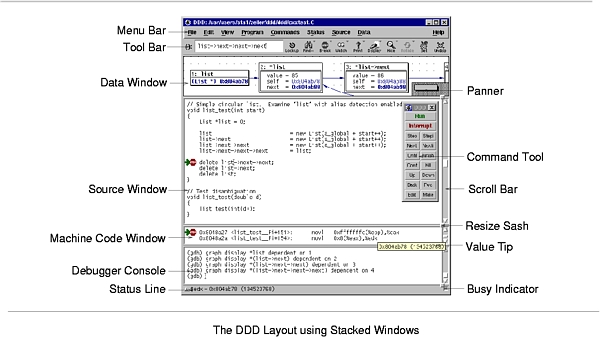
Besides these three main windows, there are some other optional windows:
The DDD Menu Bar gives you access to all DDD functions.
File
Edit
View
Program
Commands
Status
Source
Data
Maintenance
Help
There are two ways of selecting an item from a pull-down menu:
The menus can also be torn off (i.e. turned into a persistent window) by selecting the dashed line at the top.
If a command in the pull-down menu is not applicable in a given
situation, the command is disabled and its name appears faded.
You cannot invoke items that are faded. For example, many commands on
the Edit menu appear faded until you select text on which they
are to operate; after you select a block of text, edit commands are
enabled.
The File menu contains file-related operations such as selecting
programs, processes, and sessions, printing graphs, recompiling, as well
as exiting DDD.
Open Program
Open Class
Open Recent
Open Core Dump
Open Source
Open Session
Save Session As
Attach to Process
Detach Process
Print Graph
Change Directory
Make
make program. See Recompiling, for details.
Close
Restart
Exit
The Edit menu contains standard editing operations, such as
cutting, copying, pasting, and killing selected text. Also allows
editing DDD options and preferences.
Undo
Redo
Cut
This item can also be applied to displays (see Deleting Displays).
Copy
This item can also be applied to displays (see Deleting Displays).
Paste
Copy or Cut. You can also use
Paste to insert text that was pasted into the clipboard from
other applications.
Clear
Delete
This item can also be applied to displays (see Deleting Displays).
Select All
Preferences
Debugger Settings
Save Options
The View menu allows accessing the individual DDD
windows.
Command Tool
Execution Window
Debugger Console
Source Window
Data Window
Machine Code Window
The Program menu performs operations related to the program being
debugged, such as starting and stopping the program.
Most of these operations are also found on the command tool (see Command Tool).
Run
Run Again
Run in Execution Window
Step
Step Instruction
Next
Step, but function calls that appear
within the line of code are executed without stopping.
See Resuming Execution, for details.
Next Instruction
Until
Finish
Continue
Continue Without Signal
Continue. See Signals, for details.
Kill
Interrupt
Abort
SIGABRT signal to the process.
See Quitting, for details.
The Commands menu performs operations related to DDD
commands, such as accessing the command history or defining new
commands.
Most of these items are not meant to be actually executed via the menu; instead, they serve as reminder for the equivalent keyboard commands.
Command History
Previous
Next
Find Backward
Find Forward
Quit Search
Complete
Apply
Clear Line
Clear Window
Define Command
Edit Buttons
The Status menu lets you examine the program status, such as the
stack traces, registers, or threads.
Backtrace
Registers
Threads
Signals
Up
Down
The Source menu performs source-related operations such as
looking up items or editing breakpoints.
Breakpoints
Lookup ()
() in the source code. See Looking up Definitions, for details.
Find >> ()
() in the current
source code. See Textual Search, for details.
Find << ()
() in the current
source code. See Textual Search, for details.
Find Words Only
Find Case Sensitive
Display Line Numbers
Display Machine Code
Edit Source
Reload Source
The Data menu performs data-related operations such as editing
displays or layouting the display graph.
Displays
Watchpoints
Memory
Print ()
() in the debugger console. See Printing Values, for details.
Display ()
() in the data window. See Displaying Values, for details.
Detect Aliases
Display Local Variables
Display Arguments
Status Displays
Align on Grid
Rotate Graph
Layout Graph
Refresh
The Maintenance menu performs operations that are useful for
debugging DDD.
By default, this menu is disabled; it is enabled by specifically
requesting it at DDD invocation (via the --maintenance
option; see Options). It is also enabled when DDD gets a
fatal signal.
Debug DDD
Dump Core Now
SIGUSR1 signal.
Tic Tac Toe
New Game to restart.
When DDD Crashes
Debug DDD
Dump Core
Do Nothing
Remove Menu
The Help menu gives help on DDD usage. See Getting Help, for a discussion on how to get help within DDD.
Overview
On Item
On Window
What Now?
Tip of the Day
DDD Reference
DDD News
Debugger Reference
DDD License
DDD WWW Page
About DDD
The Menu Bar can be customized in various ways (see Customizing).
You can cause pull-down menus to be raised automatically.
| autoRaiseMenu (class AutoRaiseMenu) | Resource |
If on (default), DDD will always keep the pull down menu
on top of the DDD main window. If this setting interferes with
your window manager, or if your window manager does not auto-raise
windows, set this resource to off.
|
| autoRaiseMenuDelay (class AutoRaiseMenuDelay) | Resource |
The time (in ms) during which an initial auto-raised window blocks
further auto-raises. This is done to prevent two overlapping
auto-raised windows from entering an auto-raise loop. Default is
100.
|
In the Menu Bar, the Edit Menu can be customized in various ways.
Use Edit => Preferences => Startup to customize
these keys.
The <Ctrl+C> key can be bound to different actions, each in accordance with a specific style guide.
Copy
Interrupt
The <Ctrl+A> key can be bound to different actions, too.
Select All
Select All
operation, as specified by the KDE style guide. In this setting, use
<Home> to move the cursor to the beginning of a line.
Beginning of Line
Beginning of Line
operation, as used in several UNIX text-editing programs. In this
setting, use <Ctrl+Shift+A> to select all text.
Here are the related DDD resources:
| cutCopyPasteBindings (class BindingStyle) | Resource |
Controls the key bindings for clipboard operations.
|
| selectAllBindings (class BindingStyle) | Resource |
Controls the key bindings for the Select All operation.
|
Some DDD commands require an argument. This argument
is specified in the argument field, labeled ():.
Basically, there are four ways to set arguments:
(): label.
Using GDB and Perl, the argument field provides a completion mechanism. You can enter the first few characters of an item an press the <TAB> key to complete it. Pressing <TAB> again shows alternative completions.
After having entered an argument, you can select one of the buttons on
the right. Most of these buttons also have menus associated with them;
this is indicated by a small arrow in the upper right corner. Pressing
and holding mouse button 1 on such a button will pop up a menu
with further operations.
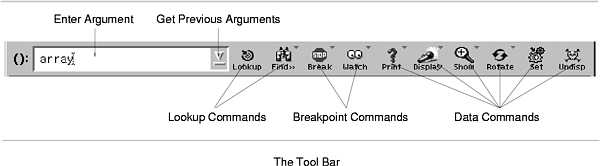
These are the buttons of the tool bar. Note that not all buttons may be inactive, depending on the current state and the capabilities of the inferior debugger.
Lookup
Look up the argument () in the source code. See Looking up Definitions, for details.
Find >>
Look up the next occurrence of the argument () in the current
source code. See Textual Search, for details.
Break/Clear
Toggle a breakpoint (see Breakpoints) at the location ().
Break
(), then this button is labeled
Break. Clicking on Break sets a breakpoint at the
location (). See Setting Breakpoints, for details.
Clear
(), then this button is
labeled Clear. Clicking on Clear clears (deletes) the
breakpoint at the location (). See Deleting Breakpoints, for
details.
Watch/Unwatch
Toggle a watchpoint (see Watchpoints) on the expression ().
Watch
() is not being watched, then this button is labeled
Watch. Clicking on Watch creates a watchpoint on the
expression (). See Setting Watchpoints, for details.
Unwatch
() is being watched, then this button is labeled
Unwatch. Clicking on Unwatch clears (deletes) the
watchpoint on (). See Deleting Watchpoints, for details.
Print
Print the value of () in the debugger console. See Printing Values, for details.
Display
Display the value of () in the data window. See Displaying Values, for details.
Plot
Plot () in a plot window. See Plotting Values, for details.
Show/Hide
Toggle details of the selected display(s). See Showing and Hiding Details, for a discussion.
Rotate
Rotate the selected display(s). See Rotating Displays, for details.
Set
Set (change) the value of (). See Assignment, for details.
Undisp
Undisplay (delete) the selected display(s). See Deleting Displays, for details.
The DDD tool bar buttons can appear in a variety of styles,
customized via Edit => Preferences => Startup.
Images
Captions
The default is to have images as well as captions, but you can choose to
have only images (saving space) or only captions.
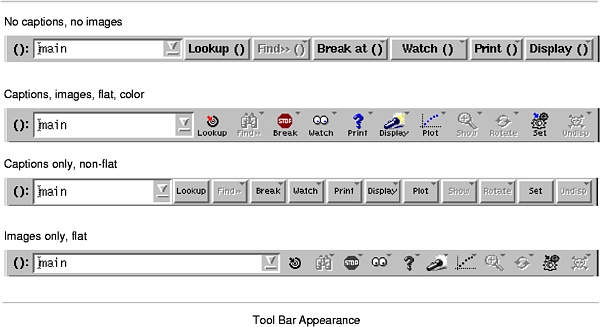
If you choose to have neither images nor captions, tool bar buttons are labeled like other buttons, as in DDD 2.x. Note that this implies that in the stacked window configuration, the common tool bar cannot be displayed; it is replaced by two separate tool bars, as in DDD 2.x.
If you enable Flat buttons (default), the border of tool bar
buttons will appear only if the mouse pointer is over them. This
latest-and-greatest GUI invention can be disabled, such that
the button border is always shown.
If you enable Color buttons, tool bar images will be colored when
entered. If DDD was built using Motif 2.0 and later, you can
also choose a third setting, where buttons appear in color all the time.
Here are the related resources (see Customizing):
| activeButtonColorKey (class ColorKey) | Resource |
The XPM color key to use for the images of active buttons
(entered or armed). c means color, g (default) means
grey, and m means monochrome.
|
| buttonCaptions (class ButtonCaptions) | Resource |
Whether the tool bar buttons should be shown using captions
(on, default) or not (off). If neither captions nor
images are enabled, tool bar buttons are shown using ordinary labels.
See also buttonImages, below.
|
| buttonCaptionGeometry (class ButtonCaptionGeometry) | Resource |
The geometry of the caption subimage within the button icons. Default
is 29x7+0-0.
|
| buttonImages (class ButtonImages) | Resource |
Whether the tool bar buttons should be shown using images (on,
default) or not (off). If neither captions nor images are
enabled, tool bar buttons are shown using ordinary labels. See also
buttonCaptions, above.
|
| buttonImageGeometry (class ButtonImageGeometry) | Resource |
The geometry of the image within the button icon. Default is
25x21+2+0.
|
| buttonColorKey (class ColorKey) | Resource |
The XPM color key to use for the images of inactive buttons
(non-entered or insensitive). c means color, g
(default) means grey, and m means monochrome.
|
| flatToolbarButtons (class FlatButtons) | Resource |
If on (default), all tool bar buttons with images or captions
are given a `flat' appearance--the 3-D border only shows up when the
pointer is over the icon. If off, the 3-D border is shown all
the time.
|
| flatDialogButtons (class FlatButtons) | Resource |
If on (default), all dialog buttons with images or captions
are given a `flat' appearance--the 3-D border only shows up when
the pointer is over the icon. If off, the 3-D border is shown
all the time.
|
The command tool is a small window that gives you access to the most frequently used DDD commands. It can be moved around on top of the DDD windows, but it can also be placed besides them.
By default, the command tool sticks to the DDD source window: Whenever you move the DDD source window, the command tool follows such that the distance between source window and command tool remains the same. By default, the command tool is also auto-raised, such that it stays on top of other DDD windows.
The command tool can be configured to appear as a command tool bar above
the source window; see Edit => Preferences => Source
=> Tool Buttons Location for details.
Whenever you save DDD state, DDD also saves the distance
between command tool and source window, such that you can select your
own individual command tool placement. To move the command tool to its
saved position, use View => Command Tool.
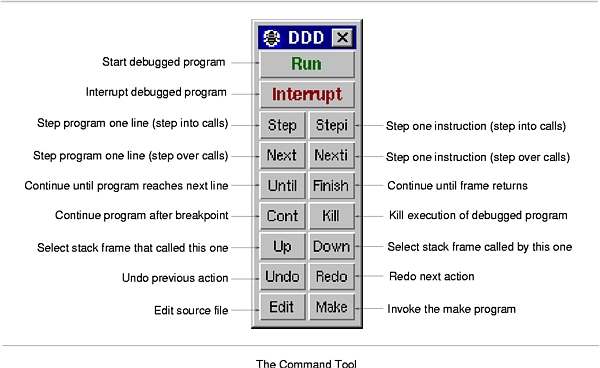
These are the buttons of the command tool. Note that not all buttons may be inactive, depending on the current state and the capabilities of the inferior debugger.
Run
Interrupt
Step
Stepi
Next
Step, but function calls that appear
within the line of code are executed without stopping.
See Resuming Execution, for details.
Nexti
Until
Finish
Cont
Kill
Up
Down
Undo
Redo
Edit
Make
make program with the most recently given arguments.
See Recompiling, for details.
The Command Tool can be customized in various ways.
See Customizing Buttons, for details on customizing the tool buttons.
You can disable the command tool and show its buttons in a separate row
beneath the tool bar. To disable the command tool, set Edit
=> Preferences => Source => Tool Buttons Location
=> Source Window.
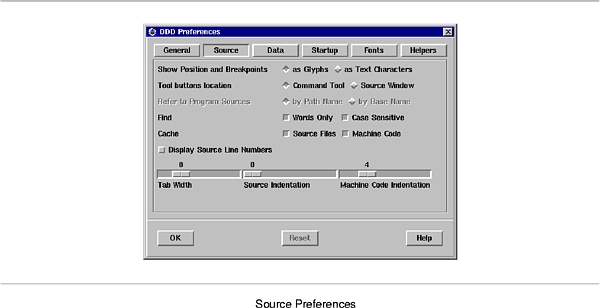
Here's the related resource:
| commandToolBar (class ToolBar) | Resource |
Whether the tool buttons should be shown in a tool bar above the source
window (on) or within the command tool (off, default).
Enabling the command tool bar disables the command tool and vice versa.
|
The following resources control the position of the command tool (see Customizing):
| autoRaiseTool (class AutoRaiseTool) | Resource |
If on (default), DDD will always keep the command tool on
top of other DDD windows. If this setting interferes with your
window manager, or if your window manager keeps the command tool on top
anyway, set this resource to off.
|
| stickyTool (class StickyTool) | Resource |
If on (default), the command tool automatically follows every
movement of the source window. Whenever the source window is moved, the
command tool is moved by the same offset such that its position relative
to the source window remains unchanged. If off, the command tool
does not follow source window movements.
|
| toolRightOffset (class Offset) | Resource |
| The distance between the right border of the command tool and the right border of the source text (in pixels). Default is 8. |
| toolTopOffset (class Offset) | Resource |
| The distance between the upper border of the command tool and the upper border of the source text (in pixels). Default is 8. |
The following resources control the decoration of the command tool (see Customizing):
| decorateTool (class Decorate) | Resource |
This resource controls the decoration of the command tool.
|
DDD has an extensive on-line help system. Here's how to get help while working with DDD.
F1 key. This
pops up a detailed help text.
Help buttons that give
detailed information about the dialog.
help at the
debugger prompt. See Entering Commands, for details on entering
commands.
Help => What Now? (the
What Now? item in the Help menu) or press <Ctrl+F1>.
Depending on the current state, DDD will give you some hints on
what you can do next.
Help => DDD Reference gives you access to the
DDD manual, the ultimate DDD reference.
Help => Debugger Reference shows you the
on-line documentation of the inferior debugger.
Help => DDD WWW Page gives you access to the
latest and greatest information on DDD.
All these functions can be customized in various ways (see Customizing Help).
If, after all, you made a mistake, don't worry: almost every DDD command can be undone. See Undo and Redo, for details.
Almost every DDD command can be undone, using Edit
=> Undo or the Undo button on the command tool.
Likewise, Edit => Redo repeats the command most recently
undone.
The Edit menu shows which commands are to be undone and redone
next; this is also indicated by the popup help on the Undo and
Redo buttons.
DDD is controlled by several resources--user-defined variables that take specific values in order to control and customize DDD behavior.
Most DDD resources can be set interactively while DDD is running or when invoking DDD. See Resource Index, for the full list of DDD resources.
We first discuss how customizing works in general; then we turn to customizing parts of DDD introduced so far.
Just like any X program, DDD has a number of places to get resource values from. For DDD, the most important places to specify resources are:
~/.ddd/init file (~ stands for your home
directory). This file is read in by DDD upon start-up; the
resources specified herein override all other sources (except for
resources given implicitly by command-line options).
If the environment variable DDD_STATE is set, its value
is used instead of ~/.ddd/.
Ddd application-defaults file. This file is
typically compiled into the DDD executable. If it exists, its
resource values override the values compiled into DDD. If the
versions of the Ddd application-defaults file and the
DDD executable do not match, DDD may not function
properly; DDD will give you a warning in this case.8
DDD_SESSION is set, it
indicates the name of a session to start, overriding all options and
resources. This is used by DDD when restarting itself.
Not every resource has a matching command-line option. Each resource
(whether in ~/.ddd/init or Ddd) is
specified using a line
Ddd*resource: value
For instance, to set the pollChildStatus resource to off,
you would specify in ~/.ddd/init:
Ddd*pollChildStatus: off
For more details on the syntax of resource specifications, see the section RESOURCES in the X(1) manual page.
You can change DDD resources by three methods:
Edit =>
Preferences. This works for the most important DDD resources.
Be sure to save the options (see Saving Options) such that they
apply to future DDD sessions, too.
.ddd/init in your home directory.
See Resource Index, for a list of DDD resources to be set.
You can save the current option settings by selecting Edit
=> Save Options. Options are saved in a file named
.ddd/init in your home directory. If a session
session is active, options will be saved in
~/.ddd/sessions/session/init instead.
DDD Help can be customized in various ways.
Button tips are helpful for novices, but may be distracting for
experienced users. You can turn off button tips via Edit
=> Preferences => General => Automatic display of
Button Hints => as Popup Tips.
You can also turn off the hint that is displayed in the status line.
Just toggle Edit => Preferences => General =>
Automatic Display of Button Hints => in the Status Line.
Here are related DDD resources (see Customizing):
| buttonTips (class Tips) | Resource |
If on (default), enable button tips.
|
| buttonDocs (class Docs) | Resource |
If on (default), show button hints in the status line.
|
You can turn off the tip of the day by toggling Edit =>
Preferences => Startup => Startup Windows => Tip of
the Day.
Here is the related DDD resource (see Customizing):
| startupTips (class StartupTips) | Resource |
If on (default), show a tip of the day upon DDD startup.
|
See Options, for options to set this resource upon DDD invocation.
The actual tips are controlled by these resources (see Customizing):
| startupTipCount (class StartupTipCount) | Resource |
The number n of the tip of the day to be shown at startup. See
also the tipn resources.
|
| tipn (class Tip) | Resource |
| The tip of the day numbered n (a string). |
DDD relies on a number of external commands, specified via
Edit => Preferences => Helpers.
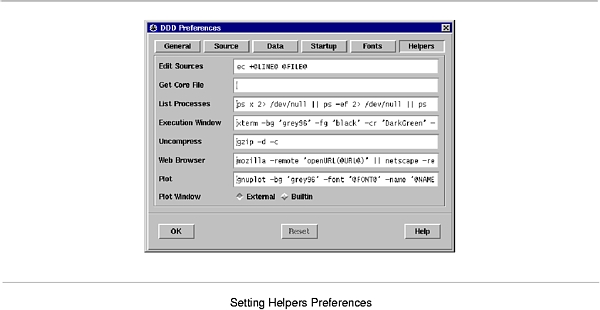
To uncompress help texts, you can define a Uncompress command:
| uncompressCommand (class UncompressCommand) | Resource |
The command to uncompress the built-in DDD manual, the
DDD license, and the DDD news. Takes a compressed text
from standard input and writes the uncompressed text to standard output.
The default value is gzip -d -c; typical values include
zcat and gunzip -c.
|
To view WWW pages, you can define a Web Browser command:
| wwwCommand (class WWWCommand) | Resource |
The command to invoke a WWW browser. The string @URL@ is
replaced by the URL to open. Default is to try a running
Netscape first (trying mozilla, then netscape), then
$WWWBROWSER, then to invoke a new Netscape process, then to
let a running Emacs do the job, then to invoke Mosaic, then to invoke
Lynx in an xterm.
To specify Ddd*wwwCommand: \
netscape-4.0 -remote 'openURL(@URL@)' \
|| netscape-4.0 '@URL@'
This command first tries to connect to a running |
This is the default WWW Page shown by Help DDD WWW
Page:
| wwwPage (class WWWPage) | Resource |
| The DDD WWW page. Value: http://www.gnu.org/software/ddd/ |
DDD Undo can be customized in various ways.
To set a maximum size for the undo buffer, set Edit =>
Preferences => General => Undo Buffer Size.
This is related to the maxUndoSize resource:
| maxUndoSize (class MaxUndoSize) | Resource |
The maximum memory usage (in bytes) of the undo buffer. Useful for
limiting DDD memory usage. A negative value means to place no
limit. Default is 2000000, or 2000 kBytes.
|
You can also limit the number of entries in the undo buffer, regardless of size (see Customizing):
| maxUndoDepth (class MaxUndoDepth) | Resource |
| The maximum number of entries in the undo buffer. This limits the number of actions that can be undone, and the number of states that can be shown in historic mode. Useful for limiting DDD memory usage. A negative value (default) means to place no limit. |
To clear the undo buffer at any time, thus reducing memory usage, use
Edit => Preferences => General => Clear Undo
Buffer
You can customize the DDD Windows in various ways.
You can turn off the DDD splash screen shown upon startup. Just
select Edit => Preferences => Startup DDD
Splash Screen.
The value applies only to the next DDD invocation.
This setting is related to the following resource:
| splashScreen (class SplashScreen) | Resource |
If on (default), show a DDD splash screen upon
start-up.
|
You can also customize the appearance of the splash screen (see Customizing):
| splashScreenColorKey (class ColorKey) | Resource |
The color key to use for the DDD splash screen. Possible
values include:
Please note: if DDD runs on a monochrome display, or if DDD was
compiled without the XPM library, only the monochrome version
( |
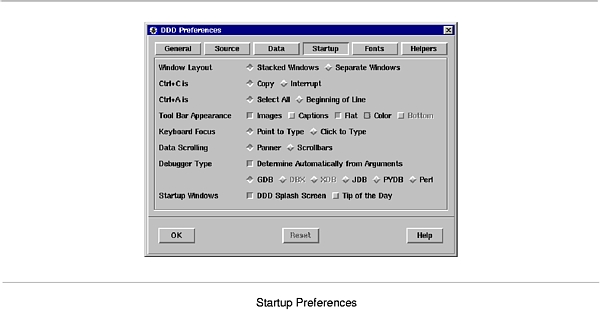
By default, DDD stacks commands, source, and data in one single
top-level window. To have separate top-level windows for source, data,
and debugger console, set Edit => Preferences =>
Startup => Window Layout => Separate Windows.
Here are the related DDD resources:
| separateDataWindow (class Separate) | Resource |
If on, the data window and the debugger console are realized in
different top-level windows. If off (default), the data window
is attached to the debugger console.
|
| separateSourceWindow (class Separate) | Resource |
If on, the source window and the debugger console are realized in
different top-level windows. If off (default), the source window
is attached to the debugger console.
|
By default, the DDD tool bars are located on top of the window.
If you prefer the tool bar being located at the bottom, as in
DDD 2.x and earlier, set Edit => Preferences
=> Startup => Tool Bar Appearance => Bottom.
This is related to the toolbarsAtBottom resource:
| toolbarsAtBottom (class ToolbarsAtBottom) | Resource |
Whether source and data tool bars should be placed above source and
data, respectively (off, default), or below, as in DDD
2.x (on).
|
The bottom setting is only supported for separate tool bars--that is, you must either choose separate windows or configure the tool bar to have neither images nor captions (see Customizing the Tool Bar).
If you use stacked windows, you can choose whether there should be one tool bar or two tool bars. By default, DDD uses two tool bars if you use separate windows and disable captions and images, but you can also explicitly change the setting via this resource:
| commonToolBar (class ToolBar) | Resource |
Whether the tool bar buttons should be shown in one common tool bar at
the top of the common DDD window (on, default), or
whether they should be placed in two separate tool bars, one for data,
and one for source operations, as in DDD 2.x (off).
|
You can also change the location of the status line (see Customizing):
| statusAtBottom (class StatusAtBottom) | Resource |
If on (default), the status line is placed at the bottom of the
DDD source window. If off, the status line is placed at
the top of the DDD source window (as in DDD 1.x).
|
See Options, for options to set these resources upon DDD invocation.
You can configure the basic DDD fonts at run-time. Each font is specified using two members:
foundry- specification may be omitted, as well as any
specification after family. Thus, a pair
family-weight usually suffices.
To specify fonts, select Edit => Preferences =>
Fonts.
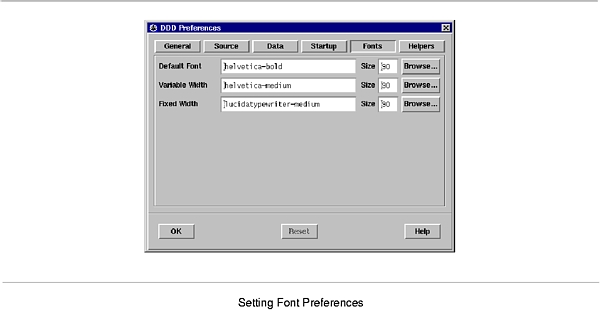
The Browse button opens a font selection program, where you can
select fonts and attributes interactively. Clicking quit or
select in the font selector causes all non-default values to be
transferred to the DDD font preferences panel.
The following fonts can be set using the preferences panel:
Default Font
helvetica-bold.
Variable Width
helvetica-medium.
Fixed Width
lucidatypewriter-medium.
Changes in this panel will not take effect immediately. Instead, you can
Edit => Save Options) to make the change
effective for future DDD sessions,
File => Restart DDD)
to make it effective for the restarted DDD session.
After having made changes in the panel, DDD will automatically offer you to restart itself, such that you can see the changes taking effect. Note that even after restarting, you still must save options to make the changes permanent.
The Reset button restores the most recently saved preferences.
Here are the resources related to font specifications:
| defaultFont (class Font) | Resource |
|
The default DDD font to use for labels, menus, buttons, etc.
The font is specified as an X font spec, where the initial Foundry
specification may be omitted, as well as any specification after
Family.
Default value is To set the default DDD font to, say, Ddd*defaultFont: helvetica-medium in your |
| defaultFontSize (class FontSize) | Resource |
The size of the default DDD font, in 1/10 points. This resource
overrides any font size specification in the defaultFont resource
(see above). The default value is 120 for a 12.0 point font.
|
| variableWidthFont (class Font) | Resource |
|
The variable width DDD font to use for help texts and messages.
The font is specified as an X font spec, where the initial Foundry
specification may be omitted, as well as any specification after
Family.
Default value is To set the variable width DDD font family to, say,
Ddd*fixedWidthFont: times-medium in your |
| variableWidthFontSize (class FontSize) | Resource |
The size of the variable width DDD font, in 1/10 points. This
resource overrides any font size specification in the
variableWidthFont resource (see above). The default value is
120 for a 12.0 point font.
|
| fixedWidthFont (class Font) | Resource |
|
The fixed width DDD font to use for source code, the debugger
console, text fields, data displays, and the execution window. The font
is specified as an X font spec, where the initial Foundry
specification may be omitted, as well as any specification after
Family.
Default value is to To set the fixed width DDD font family to, say, Ddd*fixedWidthFont: courier-medium in your |
| fixedWidthFontSize (class FontSize) | Resource |
The size of the fixed width DDD font, in 1/10 points. This
resource overrides any font size specification in the
fixedWidthFont resource (see above). The default value is
120 for a 12.0 point font.
|
As all font size resources have the same class (and by default the same value), you can easily change the default DDD font size to, say, 9.0 points by inserting a line
Ddd*FontSize: 90
in your ~/.ddd/init file.
Here's how to specify the command to select fonts:
| fontSelectCommand (class FontSelectCommand) | Resource |
A command to select from a list of fonts. The string @FONT@ is
replaced by the current DDD default font; the string
@TYPE@ is replaced by a symbolic name of the DDD font
to edit. The program must either place the name of the selected font in
the PRIMARY selection or print the selected font on standard
output. A typical value is:
Ddd*fontSelectCommand: xfontsel -print |
See Options, for options to set these resources upon DDD invocation.
In the default stacked window setting, you can turn the individual
DDD windows on and off by toggling the respective items in the
View menu (see View Menu). When using separate windows
(see Window Layout), you can close the individual windows via
File => Close or by closing them via your window manager.
Whether windows are opened or closed when starting DDD is
controlled by the following resources, immediately tied to the
View menu items:
| openDataWindow (class Window) | Resource |
If off (default), the data window is closed upon start-up.
|
| openDebuggerConsole (class Window) | Resource |
If off, the debugger console is closed upon start-up.
|
| openSourceWindow (class Window) | Resource |
If off, the source window is closed upon start-up.
|
See Options, for options to set these resources upon DDD invocation.
The DDD text fields can be customized using the following resources:
| popdownHistorySize (class HistorySize) | Resource |
The maximum number of items to display in pop-down value histories. A
value of 0 (default) means an unlimited number of values.
|
| sortPopdownHistory (class SortPopdownHistory) | Resource |
If on (default), items in the pop-down value histories are sorted
alphabetically. If off, most recently used values will appear at
the top.
|
If you frequently switch between DDD and other multi-window
applications, you may like to set Edit => Preferences
=> General => Iconify all windows at once. This
way, all DDD windows are iconified and deiconified as a group.
This is tied to the following resource:
| groupIconify (class GroupIconify) | Resource |
If this is on, (un)iconifying any DDD window
causes all other DDD windows to (un)iconify as well.
Default is off, meaning that each DDD window can
be iconified on its own.
|
If you want to keep DDD off your desktop during a longer
computation, you may like to set Edit => Preferences
=> General => Uniconify when ready. This way, you can
iconify DDD while it is busy on a command (e.g. running a
program); DDD will automatically pop up again after becoming
ready (e.g. after the debugged program has stopped at a breakpoint).
See Program Stop, for a discussion.
Here is the related resource:
| uniconifyWhenReady (class UniconifyWhenReady) | Resource |
If this is on (default), the DDD windows are uniconified
automatically whenever GDB becomes ready. This way, you can iconify
DDD during some longer operation and have it uniconify itself as
soon as the program stops. Setting this to off leaves the
DDD windows iconified.
|
You can extend DDD with new buttons. See Defining Buttons, for details.
You can change just about any label, color, keyboard mapping, etc. by
changing resources from the Ddd application defaults file which
comes with the DDD source distribution. Here's how it works:
Ddd file.
~/.ddd/init file
and change it at will.
See Application Defaults, for details on the application-defaults file.
For most inferior debuggers, you can change their internal settings
using Edit => Settings. Using the settings editor, you
can determine whether C++ names are to be demangled, how many array
elements are to print, and so on.
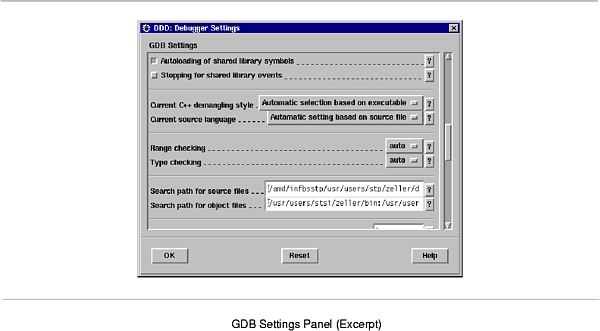
The capabilities of the settings editor depend on the capabilities of
your inferior debugger. Clicking on ? gives an an explanation on
the specific item; the GDB documentation gives more details.
Use Edit => Undo to undo changes. Clicking on
Reset restores the most recently saved settings.
Some debugger settings are insensitive and cannot be changed, because
doing so would endanger DDD operation. See the
gdbInitCommands and dbxInitCommands resources for details.
All debugger settings (except source and object paths) are saved with DDD options.
This chapter discusses how to access code from within DDD.
In order to debug a program effectively, you need to generate debugging information when you compile it. This debugging information is stored in the object file; it describes the data type of each variable or function and the correspondence between source line numbers and addresses in the executable code.9
To request debugging information, specify the -g option when you
run the compiler.
Many C compilers are unable to handle the -g and -O
options together. Using those compilers, you cannot generate optimized
executables containing debugging information.
GCC, the GNU C compiler, supports -g with or without
-O, making it possible to debug optimized code. We recommend
that you always use -g whenever you compile a program.
You may think your program is correct, but there is no sense in pushing
your luck.
When you debug a program compiled with -g -O, remember that the
optimizer is rearranging your code; the debugger shows you what is
really there. Do not be too surprised when the execution path does not
exactly match your source file! An extreme example: if you define a
variable, but never use it, DDD never sees that
variable--because the compiler optimizes it out of existence.
If you did not invoke DDD specifying a program to be debugged,
you can use the File menu to open programs, core dumps and
sources.
To open a program to be debugged, select File => Open
Program.10
Click on Open to open the program
In JDB, select File => Open Class instead. This gives you
a list of available classes to choose from.
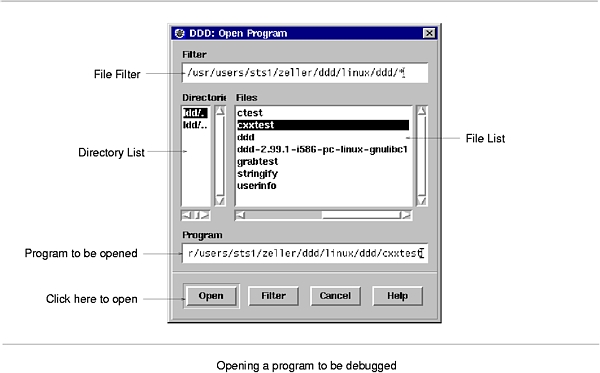
To re-open a recently debugged program or class, select File
=> Open Recent and choose a program or class from the list.
If no sources are found, See Source Path, for specifying source directories.
If a previous run of the program has crashed and you want to find out why, you can have DDD examine its core dump.11
To open a core dump for the program, select File => Open
Core Dump. Click on Open to open the core dump.
Before Open Core Dump, you should first use File =>
Open Program to specify the program that generated the core dump and to
load its symbol table.
To open a source file of the debugged program, select File
=> Open Source.
Click on Open to open the source file. See Source Path, if no
sources are found.
When presenting files to be opened, DDD by default filters files when opening execution files, core dumps, or source files, such that the selection shows only suitable files. This requires that DDD opens each file, which may take time. See Customizing File Filtering, if you want to turn off this feature.
As soon as the source of the debugged program is available, the source window displays its current source text. (see Source Path, if a source text cannot be found.)
In the source window, you can lookup and examine function and variable definitions as well as search for arbitrary occurrences in the source text.
If you wish to lookup a specific function or variable definition whose
name is visible in the source text, click with mouse button 1 on
the function or variable name. The name is copied to the argument
field. Change the name if desired and click on the Lookup button
to find its definition.
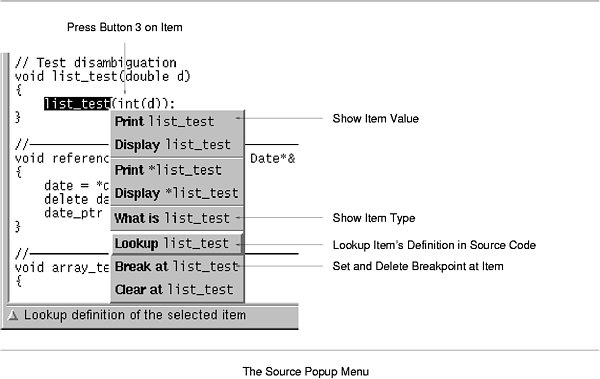
As a faster alternative, you can simply press mouse button 3 on the
function name and select the Lookup item from the source popup
menu.
As an even faster alternative, you can also double-click on a function
call (an identifier followed by a ( character) to lookup the
function definition.
If a source file is not found, See Source Path, for specifying source directories.
If the item you wish to search is visible in the source text, click with
mouse button 1 on it. The identifier is copied to the argument
field. Click on the Find >> button to find following occurrences
and on Find >> => Find << () to find previous occurrences.
By default, DDD finds only complete words. To search for
arbitrary substrings, change the value of the Source =>
Find Words Only option.
After looking up a location, use Edit => Undo (or the
Undo button on the command tool) to go back to the original
locations. Edit => Redo brings you back again to the
location you looked for.
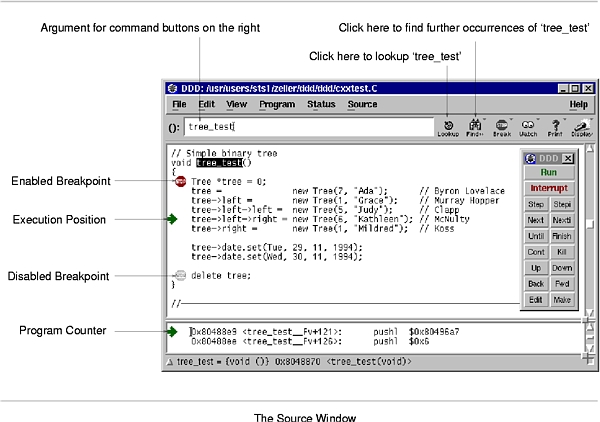
Executable programs sometimes do not record the directories of the source files from which they were compiled, just the names. Even when they do, the directories could be moved between the compilation and your debugging session.
Here's how GDB accesses source files; other inferior debuggers have similar methods.
GDB has a list of directories to search for source files; this is called the source path. Each time GDB wants a source file, it tries all the directories in the list, in the order they are present in the list, until it finds a file with the desired name. Note that the executable search path is not used for this purpose. Neither is the current working directory, unless it happens to be in the source path.
If GDB cannot find a source file in the source path, and the object program records a directory, GDB tries that directory too. If the source path is empty, and there is no record of the compilation directory, GDB looks in the current directory as a last resort.
To specify a source path for your inferior debugger, use Edit
=> Debugger Settings (see Debugger Settings and search for
appropriate entries (in GDB, this is Search path for source
files).
If Debugger Settings has no suitable entry, you can also specify
a source path for the inferior debugger when invoking DDD.
See Inferior Debugger Options, for details.
When using JDB, you can set the CLASSPATH environment variable to
specify directories where JDB (and DDD) should search for
classes.
If DDD does not find a source file for any reason, check the following issues:
-g option when you run the
compiler. See Compiling for Debugging, for details.
Using GDB, you can also create a local .gdbinit file that
contains a line directory path. Here, path is a
colon-separated list of source paths.
The source window can be customized in a number of ways, most of them
accessed via Edit => Preferences => Source.
In the source text, the current execution position and breakpoints are
indicated by symbols (glyphs). As an alternative, DDD can
also indicate these positions using text characters. If you wish to
disable glyphs, set Edit => Preferences => Source
=> Show Position and Breakpoints => as Text Characters
option. This also makes DDD run slightly faster, especially
when scrolling.
This setting is tied to this resource:
| displayGlyphs (class DisplayGlyphs) | Resource |
If this is on, the current execution position and breakpoints are
displayed as glyphs; otherwise, they are shown through characters in the
text. The default is on. See Options, for the
--glyphs and --no-glyphs options.
|
You can further control glyphs using the following resources:
| cacheGlyphImages (class CacheMachineCode) | Resource |
Whether to cache (share) glyph images (on) or not
(off). Caching glyph images requires less X resources, but
has been reported to fail with Motif 2.1 on XFree86 servers. Default
is off for Motif 2.1 or later on GNU/Linux machines, and
on otherwise.
|
| glyphUpdateDelay (class GlyphUpdateDelay) | Resource |
A delay (in ms) that says how much time to wait before updating glyphs
while scrolling the source text. A small value results in glyphs
being scrolled with the text, a large value disables glyphs while
scrolling and makes scrolling faster. Default: 10.
|
| maxGlyphs (class MaxGlyphs) | Resource |
The maximum number of glyphs to be displayed (default: 10).
Raising this value causes more glyphs to be allocated, possibly
wasting resources that are never needed.
|
Searching in the source text (see Textual Search) is controlled by
these resources, changed via the Source menu:
| findCaseSensitive (class FindCaseSensitive) | Resource |
If this is on (default), the Find commands are
case-sensitive. Otherwise, occurrences are found regardless of case.
|
| findWordsOnly (class FindWordsOnly) | Resource |
If this is on (default), the Find commands find
complete words only. Otherwise, arbitrary occurrences are found.
|
You can have DDD show line numbers within the source window.
Use Edit => Preferences => Source => Display
Source Line Numbers.
| displayLineNumbers (class DisplayLineNumbers) | Resource |
If this is on, lines in the source text are prefixed with
their respective line number. The default is off.
|
You can instruct DDD to indent the source code, leaving more
room for breakpoints and execution glyphs. This is done using the
Edit => Preferences => Source => Source
indentation slider. The default value is 0 for no indentation
at all.
| indentSource (class Indent) | Resource |
The number of columns to indent the source code, such that there is
enough place to display breakpoint locations. Default: 0.
|
By default, DDD uses a minimum indentation for script languages.
| indentScript (class Indent) | Resource |
The minimum indentation for script languages, such as Perl and Python.
Default: 4.
|
The maximum width of line numbers is controlled by this resource.
| lineNumberWidth (class LineNumberWidth) | Resource |
The number of columns to use for line numbers (if displaying line
numbers is enabled). Line numbers wider than this value extend into
the breakpoint space. Default: 4.
|
If your source code uses a tab width different from 8 (the
default), you can set an alternate width using the Edit =>
Preferences => Source => Tab width slider.
| tabWidth (class TabWidth) | Resource |
The tab width used in the source window (default: 8)
|
These resources control when the source window is scrolled:
| linesAboveCursor (class LinesAboveCursor) | Resource |
The minimum number of lines to show before the current location.
Default is 2.
|
| linesBelowCursor (class LinesBelowCursor) | Resource |
The minimum number of lines to show after the current location.
Default is 3.
|
Some DBX and XDB variants do not properly handle paths in source file
specifications. If you want the inferior debugger to refer to source
locations by source base names only, unset the Edit =>
Preferences => Source => Refer to Program Sources by full
path name option.
This is related to the following resource:
| useSourcePath (class UseSourcePath) | Resource |
If this is off (default), the inferior debugger refers to
source code locations only by their base names. If this is
on (default), DDD uses the full source code paths.
|
By default, DDD caches source files in memory. This is
convenient for remote debugging, since remote file access may be slow.
If you want to reduce memory usage, unset the Edit =>
Preferences => Source => Cache source files option.
This is related to the following resource:
| cacheSourceFiles (class CacheSourceFiles) | Resource |
Whether to cache source files (on, default) or not
(off). Caching source files requires more memory, but makes
DDD run faster.
|
You can control whether DDD should filter files to be opened.
| filterFiles (class FilterFiles) | Resource |
If this is on (default), DDD filters files when opening
execution files, core dumps, or source files, such that the selection
shows only suitable files. This requires that DDD opens each
file, which may take time. If this is off, DDD always
presents all available files.
|
The principal purposes of using a debugger are so that you can stop your program before it terminates; or so that, if your program runs into trouble, you can investigate and find out why.
Inside DDD, your program may stop for any of several reasons,
such as a signal, a breakpoint, or reaching a new line after a
DDD command such as Step. You may then examine and
change variables, set new breakpoints or remove old ones, and then
continue execution.
The inferior debuggers supported by DDD support two mechanisms for stopping a program upon specific events:
You can set breakpoints by location or by name.
Breakpoints are set at a specific location in the program.
If the source line is visible, click with mouse button 1 on the
left of the source line and then on the Break button.
As a faster alternative, you can simply press mouse button 3 on
the left of the source line and select the Set Breakpoint item
from the line popup menu.
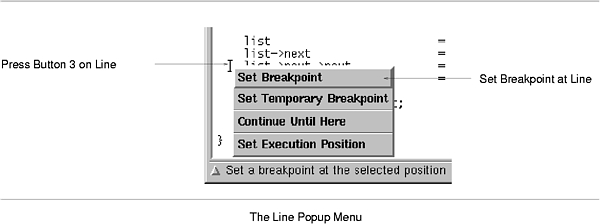
As an even faster alternative, you can simply double-click on the left of the source line to set a breakpoint.
As yet another alternative, you can select Source =>
Breakpoints. Click on the Break button and enter the location.
(If you find this number of alternatives confusing, be aware that DDD users fall into three categories, which must all be supported. Novice users explore DDD and may prefer to use one single mouse button. Advanced users know how to use shortcuts and prefer popup menus. Experienced users prefer the command line interface.)
Breakpoints are indicated by a plain stop sign, or as #n,
where n is the breakpoint number. A greyed out stop sign (or
_n_) indicates a disabled breakpoint. A stop sign with a
question mark (or ?n?) indicates a conditional breakpoint
or a breakpoint with an ignore count set.
If you set a breakpoint by mistake, use Edit => Undo to delete
it again.
If the function name is visible, click with mouse button 1 on the
function name. The function name is then copied to the argument field.
Click on the Break button to set a breakpoint there.
As a shorter alternative, you can simply press mouse button 3 on
the function name and select the Break at item from the popup
menu.
As yet another alternative, you can click on Break... from
the Breakpoint editor (invoked through Source =>
Breakpoints) and enter the function name.
Using GDB, you can also set a breakpoint on all functions that match a
given string. Break => Set Breakpoints at Regexp () sets
a breakpoint on all functions whose name matches the regular
expression given in (). Here are some examples:
Xm, set
() to ^Xm.
Date, set
() to ^Date::.
_fun, set () to _fun.
_test,
set () to _test$.
To delete a visible breakpoint, click with mouse button 1 on the
breakpoint. The breakpoint location is copied to the argument field.
Click on the Clear button to delete all breakpoints there.
If the function name is visible, click with mouse button 1 on the
function name. The function name is copied to the argument field.
Click on the Clear button to clear all breakpoints there.
As a faster alternative, you can simply press mouse button 3 on
the breakpoint and select the Delete Breakpoint item from the
popup menu.
As yet another alternative, you can select the breakpoint and click on
Delete in the Breakpoint editor (invoked through Source
=> Breakpoints).
As an even faster alternative, you can simply double-click on the breakpoint while holding <Ctrl>.
Rather than deleting a breakpoint or watchpoint, you might prefer to disable it. This makes the breakpoint inoperative as if it had been deleted, but remembers the information on the breakpoint so that you can enable it again later.12
To disable a breakpoint, press mouse button 3 on the breakpoint
symbol and select the Disable Breakpoint item from the breakpoint
popup menu. To enable it again, select Enable Breakpoint.
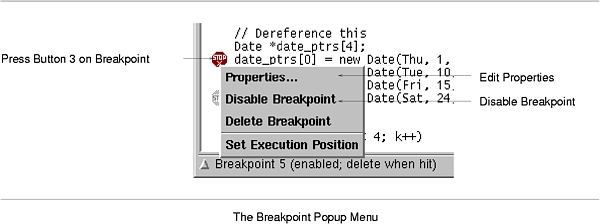
As an alternative, you can select the breakpoint and click on
Disable or Enable in the Breakpoint editor (invoked
through Source => Breakpoints.
Disabled breakpoints are indicated by a grey stop sign, or
_n_, where n is the breakpoint number.
The Disable Breakpoint item is also accessible via the
Clear button. Just press and hold mouse button 1 on the
button to get a popup menu.
A temporary breakpoint is immediately deleted as soon as it is reached.13
To set a temporary breakpoint, press mouse button 3 on the left
of the source line and select the Set Temporary Breakpoint item
from the popup menu.
As a faster alternative, you can simply double-click on the left of the source line while holding <Ctrl>.
Temporary breakpoints are convenient to make the program continue up to a specific location: just set the temporary breakpoint at this location and continue execution.
The Continue Until Here item from the popup menu sets a temporary
breakpoint on the left of the source line and immediately continues
execution. Execution stops when the temporary breakpoint is reached.
The Set Temporary Breakpoint and Continue Until Here items
are also accessible via the Break button. Just press and hold
mouse button 1 on the button to get a popup menu.
You can change all properties of a breakpoint by pressing mouse
button 3 on the breakpoint symbol and select Properties
from the breakpoint popup menu. This will pop up a dialog showing the
current properties of the selected breakpoint.
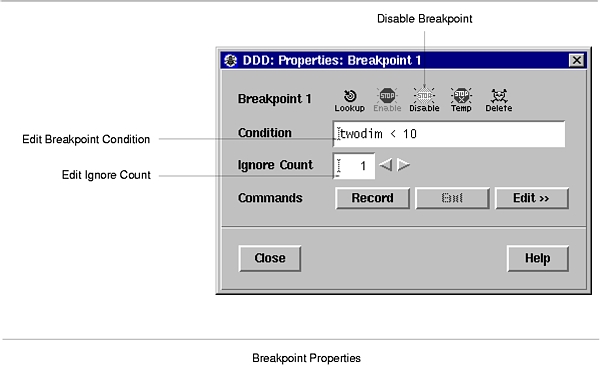
As an even faster alternative, you can simply double-click on the breakpoint.
Lookup to move the cursor to the breakpoint's
location.
Enable to enable the breakpoint.
Disable to disable the breakpoint.
Temp to make the breakpoint temporary.14
Delete to delete the breakpoint.
The simplest sort of breakpoint breaks every time your program reaches a specified place. You can also specify a condition for a breakpoint. A condition is just a Boolean expression in your programming language. A breakpoint with a condition evaluates the expression each time your program reaches it, and your program stops only if the condition is true.
This is the converse of using assertions for program validation; in that
situation, you want to stop when the assertion is violated-that is,
when the condition is false. In C, if you want to test an assertion
expressed by the condition assertion, you should set the condition
!assertion on the appropriate breakpoint.
Break conditions can have side effects, and may even call functions in your program. This can be useful, for example, to activate functions that log program progress, or to use your own print functions to format special data structures. The effects are completely predictable unless there is another enabled breakpoint at the same address. (In that case, DDD might see the other breakpoint first and stop your program without checking the condition of this one.)
Note that breakpoint commands are usually more convenient and flexible for the purpose of performing side effects when a breakpoint is reached. See Breakpoint Commands, for details.
A special case of a breakpoint condition is to stop only when the breakpoint has been reached a certain number of times. This is so useful that there is a special way to do it, using the ignore count of the breakpoint. Every breakpoint has an ignore count, which is an integer. Most of the time, the ignore count is zero, and therefore has no effect. But if your program reaches a breakpoint whose ignore count is positive, then instead of stopping, it just decrements the ignore count by one and continues. As a result, if the ignore count value is n, the breakpoint does not stop the next n times your program reaches it.
In the field Ignore Count of the Breakpoint Properties
panel, you can specify the breakpoint ignore count.15
If a breakpoint has a positive ignore count and a condition, the condition is not checked. Once the ignore count reaches zero, DDD resumes checking the condition.
You can give any breakpoint (or watchpoint) a series of DDD commands to execute when your program stops due to that breakpoint. For example, you might want to print the values of certain expressions, or enable other breakpoints.16
Using the Commands buttons of the Breakpoint Properties
panel, you can edit commands to be executed when the breakpoint is hit.
To edit breakpoint commands, click on Edit >> and enter the
commands in the commands editor. When done with editing, click on
Edit << to close the commands editor.
Using GDB, you can also record a command sequence to be executed. To record a command sequence, follow these steps:
Record to begin the recording of the breakpoint
commands.
End or enter end at the
GDB prompt. To cancel the recording, click on Interrupt
or press <ESC>.
Edit >>.
To move a breakpoint to a different location, press mouse button 1 on the stop sign and drag it to the desired location.17 This is equivalent to deleting the breakpoint at the old location and setting a breakpoint at the new location. The new breakpoint inherits all properties of the old breakpoint, except the breakpoint number.
To copy a breakpoint to a new location, press <Shift> while dragging.
If you wish to lookup a specific breakpoint, select Source
=> Breakpoints => Lookup. After selecting a breakpoint
from the list and clicking the Lookup button, the breakpoint
location is displayed.
As an alternative, you can enter #n in the argument field,
where n is the breakpoint number, and click on the Lookup
button to find its definition.
To view and edit all breakpoints at once, select Source =>
Breakpoints. This will popup the Breakpoint Editor which
displays the state of all breakpoints.
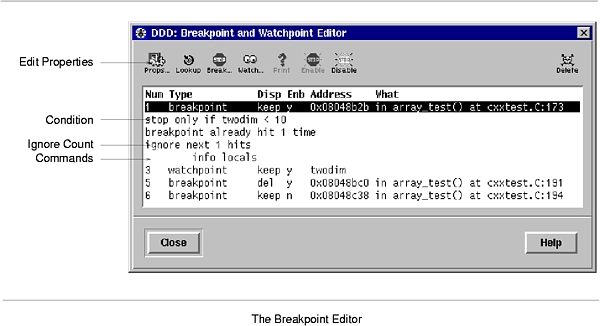
In the breakpoint editor, you can select individual breakpoints by
clicking on them. Pressing <Ctrl> while clicking toggles the
selection. To edit the properties of all selected breakpoints, click on
Props.
Using GDB, a few more commands related to breakpoints can be invoked through the debugger console:
hbreak position
thbreak pos
See Setting breakpoints, for details.
You can make the program stop as soon as some variable value changes, or when some variable is read or written. This is called setting a watchpoint on a variable.18
Watchpoints have much in common with breakpoints: in particular, you can enable and disable them. You can also set conditions, ignore counts, and commands to be executed when a watched variable changes its value.
Please note: on architectures without special watchpoint support, watchpoints currently make the program execute two orders of magnitude more slowly. This is so because the inferior debugger must interrupt the program after each machine instruction in order to examine whether the watched value has changed. However, this delay can be well worth it to catch errors when you have no clue what part of your program is the culprit.
If the variable name is visible, click with mouse button 1 on the
variable name. The variable name is copied to the argument field.
Otherwise, enter the variable name in the argument field. Click on the
Watch button to set a watchpoint there.
Using GDB, you can set different types of watchpoints. Click and hold
mouse button 1 on the Watch button to get a menu.
To change the properties of a watchpoint, enter the name of the watched
variable in the argument field. Click and hold mouse button 1 on
the Watch button and select Watchpoint Properties.
The Watchpoint Properties panel has the same functionality as the
Breakpoint Properties panel (see Editing Breakpoint Properties). As
an additional feature, you can click on Print to see the current
value of a watched variable.
To view and edit all watchpoints at once, select Data =>
Watchpoints. This will popup the Watchpoint Editor which
displays the state of all watchpoints.
The Watchpoint Editor has the same functionality as the Breakpoint
Editor (see Editing all Breakpoints). As an additional feature, you
can click on Print to see the current value of a watched
variable.
To delete a watchpoint, enter the name of the watched variable in the
argument field and click the Unwatch button.
If the program is already running (see Running), you can interrupt
it any time by clicking the Interrupt button or typing <ESC>
in a DDD window.19 Using GDB, this is
equivalent to sending a SIGINT (Interrupt) signal.
Interrupt and <ESC> also interrupt a running debugger
command, such as printing data.
If your program is a modal X application, DDD may interrupt it while it has grabbed the mouse pointer, making further interaction impossible--your X display will be unresponsive to any user actions.
By default, DDD will check after each interaction whether the pointer is grabbed. If the pointer is grabbed, DDD will continue the debugged program such that you can continue to use your X display.
This is how this feature works: When the program stops, DDD checks for input events such as keyboard or mouse interaction. If DDD does not receive any event within the next 5 seconds, DDD checks whether the mouse pointer is grabbed by attempting to grab and ungrab it. If this attempt fails, then DDD considers the pointer grabbed.
Unfortunately, DDD cannot determine the program that grabbed the pointer--it may be the debugged program, or another program. Consequently, you have another 10 seconds to cancel continuation before DDD continues the program automatically.
There is one situation where this fails: if you lock your X display
while DDD is running, then DDD will consider a resulting pointer
grab as a result of running the program--and automatically continue
execution of the debugged program. Consequently, you can turn off this
feature via Edit => Preferences => General =>
Continue Automatically when Mouse Pointer is Frozen.
The grab checks are controlled by the following resources:
| checkGrabs (class CheckGrabs) | Resource |
If this is on (default), DDD will check after each
interaction whether the pointer is grabbed. If this is so, DDD
will automatically continue execution of debugged program.
|
| checkGrabDelay (class CheckGrabDelay) | Resource |
The time to wait (in ms) after a debugger command before checking for a
grabbed pointer. If DDD sees some pointer event within this
delay, the pointer cannot be grabbed and an explicit check for a grabbed
pointer is unnecessary. Default is 5000, or 5 seconds.
|
| grabAction (class grabAction) | Resource |
The action to take after having detected a grabbed mouse pointer.
This is a list of newline-separated commands. Default is
cont, meaning to continue the debuggee. Other possible
choices include kill (killing the debuggee) or quit
(exiting DDD).
|
| grabActionDelay (class grabActionDelay) | Resource |
The time to wait (in ms) before taking an action due to having
detected a grabbed pointer. During this delay, a working dialog pops
up telling the user about imminent execution of the grab action (see
the grabAction resource, above). If the pointer grab is
released within this delay, the working dialog pops down and no action
is taken. This is done to exclude pointer grabs from sources other
than the debugged program (including DDD). Default is
10000, or 10 seconds.
|
You may start the debugged program with its arguments, if any, in an environment of your choice. You may redirect your program's input and output, debug an already running process, or kill a child process.
To start execution of the debugged program, select Program
=> Run. You will then be prompted for the arguments to pass to
your program. You can either select from a list of previously used
arguments or enter own arguments in the text field. Afterwards, press
the Run button to start execution with the selected arguments.
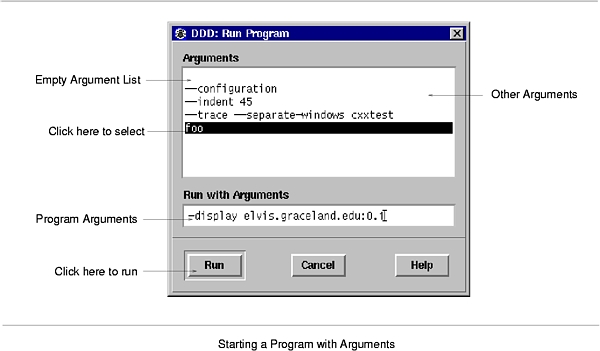
To run your program again, with the same arguments, select Program
=> Run Again or press the Run button on the command tool.
You may also enter run, followed by arguments at the debugger
prompt instead.
When you click on Run, your program begins to execute
immediately. See Stopping, for a discussion of how to arrange for
your program to stop. Once your program has stopped, you may call
functions in your program to examine data. See Examining Data, for
details.
If the modification time of your symbol file has changed since the last time GDB read its symbols, GDB discards its symbol table, and reads it again. When it does this, GDB and DDD try to retain your current debugger state, such as breakpoints.
The arguments to your program are specified by the arguments of the
run command, as composed in Program => Run.
In GDB, the arguments are passed to a shell, which expands wildcard
characters and performs redirection of I/O, and thence to your program.
Your SHELL environment variable (if it exists) specifies what
shell GDB uses. If you do not define SHELL, GDB uses
/bin/sh.
If you use another inferior debugger, the exact semantics on how the arguments are interpreted depend on the inferior debugger you are using. Normally, the shell is used to pass the arguments, so that you may use normal conventions (such as wildcard expansion or variable substitution) in describing the arguments.
Your program normally inherits its environment from the inferior debugger, which again inherits it from DDD, which again inherits it from its parent process (typically the shell or desktop).
In GDB, you can use the commands set environment and
unset environment to change parts of the environment that
affect your program. See Your program's environment,
for details.
The following environment variables are set by DDD:
DDD
DDD is set, a debuggee (or inferior debugger) can
determine whether it was invoked by DDD.
TERM
dumb, the DDD terminal type. This is set for the
inferior debugger only.20
TERMCAP
PAGER
cat, the preferred DDD pager.
The inferior debugger, in turn, might also set or unset some environment variables.
Your program normally inherits its working directory from the inferior debugger, which again inherits it from DDD, which again inherits it from its parent process (typically the shell or desktop).
You can change the working directory of the inferior debugger via
File => Change Directory or via the cd command of
the inferior debugger.
By default, the program you run under DDD does input and output to
the debugger console. Normally, you can redirect your program's input
and/or output using shell redirections with the arguments--that
is, additional arguments like < input or >
output. You can enter these shell redirections just like other
arguments (see Arguments).
Warning: While input and output redirection work, you cannot use pipes to pass the output of the program you are debugging to another program; if you attempt this, DDD may wind up debugging the wrong program. See Attaching to a Process, for an alternative.
If command output is sent to the debugger console, it is impossible for DDD to distinguish between the output of the debugged program and the output of the inferior debugger.
Program output that confuses DDD includes:
(gdb) , (dbx) or
(ladebug) )
>)
(y or n) )
Press RETURN to continue)
$pc = 0x1234)
If your program outputs any of these strings, you may encounter problems with DDD mistaking them for debugger output. These problems can easily be avoided by redirecting program I/O, for instance to the separate execution window (see Using the Execution Window).
If the inferior debugger changes the default TTY settings, for
instance through a stty command in its initialization file,
DDD may also become confused. The same applies to debugged programs
which change the default TTY settings.
The behavior of the debugger console can be controlled using the following resource:
| lineBufferedConsole (class LineBuffered) | Resource |
If this is on (default), each line from the inferior debugger is
output on each own, such that the final line is placed at the bottom of
the debugger console. If this is off, all lines are output as a
whole. This is faster, but results in a random position of the last
line.
|
By default, input and output of your program go to the debugger console. As an alternative, DDD can also invoke an execution window, where the program terminal input and output is shown.21
To activate the execution window, select Program => Run in
Execution Window.
The execution window is opened automatically as soon as you start the
debugged program. While the execution window is active, DDD
redirects the standard input, output, and error streams of your program
to the execution window. Note that the device /dev/tty still
refers to the debugger console, not the execution window.
You can override the DDD stream redirection by giving alternate
redirection operations as arguments. For instance, to have your program
read from file, but to write to the execution window, invoke your
program with < file as argument. Likewise, to redirect the
standard error output to the debugger console, use 2> /dev/tty
(assuming the inferior debugger and/or your UNIX shell support standard
error redirection).
You can customize the DDD execution window and use a different
TTY command. The command is set by Edit =>
Preferences => Helpers => Execution Window:
| termCommand (class TermCommand) | Resource |
The command to invoke for the execution window--a TTY
emulator that shows the input/output of the debugged program. A Bourne
shell command to run in the separate TTY is appended to this
string. The string @FONT@ is replaced by the name of the fixed
width font used by DDD. A simple value is
Ddd*termCommand: xterm -fn @FONT@ -e /bin/sh -c |
You can also set the terminal type:
| termType (class TermType) | Resource |
The terminal type provided by the termCommand resource--that is,
the value of the TERM environment variable to be passed to the
debugged program. Default: xterm.
|
Whether the execution window is active or not, as set by Program
=> Run in Execution Window, is saved using this resource:
| separateExecWindow (class Separate) | Resource |
If on, the debugged program is executed in a separate
execution window. If off (default), the debugged program is
executed in the console window.
|
If the debugged program is already running in some process, you can
attach to this process (instead of starting a new one with
Run).22
To attach DDD to a process, select File => Attach
to Process. You can now choose from a list of processes. Then, press
the Attach button to attach to the specified process.
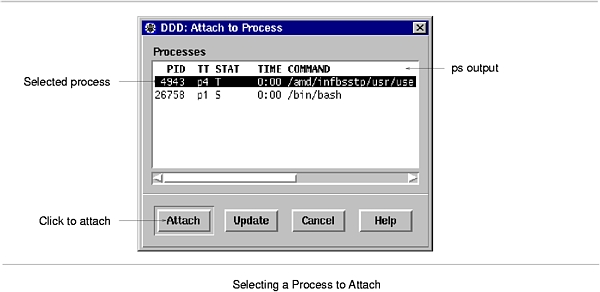
The first thing DDD does after arranging to debug the specified
process is to stop it. You can examine and modify an attached process
with all the DDD commands that are ordinarily available when you
start processes with Run. You can insert breakpoints; you can
step and continue; you can modify storage. If you would rather the
process continue running, you may use Continue after attaching
DDD to the process.
When using Attach to Process, you should first use Open
Program to specify the program running in the process and load its
symbol table.
When you have finished debugging the attached process, you can use the
File => Detach Process to release it from DDD
control. Detaching the process continues its execution. After
Detach Process, that process and DDD become
completely independent once more, and you are ready to attach another
process or start one with Run.
You can customize the list of processes shown by defining an alternate
command to list processes. See Edit => Preferences
=> Helpers => List Processes; See Customizing Attaching to Processes, for details.
When attaching to a process (see Attaching to a Process),
DDD uses a ps command to get the list of processes. This
command is defined by the psCommand resource.
| psCommand (class PsCommand) | Resource |
The command to get a list of processes. Usually ps. Depending
on your system, useful alternate values include ps -ef and
ps ux. The first line of the output must either contain a
PID title, or each line must begin with a process ID.
Note that the output of this command is filtered by DDD; a process is only shown if it can be attached to. The DDD process itself as well as the process of the inferior debugger are suppressed, too. |
After the program has been started, it runs until one of the following happens:
DDD shows the current program status in the debugger console. The current execution position is highlighted by an arrow.
If Edit => Preferences => General =>
Uniconify When Ready is set, DDD automatically deiconifies
itself when the program stops. This way, you can iconify DDD
during a lengthy computation and have it uniconify as soon as the
program stops.
To resume execution, at the current execution position, click on the
Continue button. Any breakpoints set at the current execution
position are bypassed.
To execute just one source line, click on the Step button. The
program is executed until control reaches a different source line, which
may be in a different function. Then, the program is stopped and
control returns to DDD.
Warning: If you use the Step button while control is
within a function that was compiled without debugging information,
execution proceeds until control reaches a function that does have
debugging information. Likewise, it will not step into a function which
is compiled without debugging information. To step through functions
without debugging information, use the Stepi button
(see Machine Code Execution).
In GDB, the Step button only stops at the first instruction of a
source line. This prevents the multiple stops that used to occur in
switch statements, for loops, etc. Step continues to stop if a
function that has debugging information is called within the line.
Also, the Step in GDB only enters a subroutine if there is line
number information for the subroutine. Otherwise it acts like the
Next button.
To continue to the next line in the current function, click on the
Next button. This is similar to Step, but any function
calls appearing within the line of code are executed without stopping.
Execution stops when control reaches a different line of code at the
original stack level that was executing when you clicked on Next.
To continue running until a specific location is reached, use the
Continue Until Here facility from the line popup menu.
See Temporary Breakpoints, for a discussion.
To continue until a greater line in the current function is reached,
click on the Until button. This is useful to avoid single
stepping through a loop more than once.
Until is like Next, except that when Until
encounters a jump, it automatically continues execution until the
program counter is greater than the address of the jump.
This means that when you reach the end of a loop after single stepping
though it, until makes your program continue execution until it
exits the loop. In contrast, clicking on Next at the end of a
loop simply steps back to the beginning of the loop, which forces you to
step through the next iteration.
Until always stops your program if it attempts to exit the
current stack frame.
Until works by means of single instruction stepping, and hence is
slower than continuing until a breakpoint is reached.
To continue running until the current function returns, use the
Finish button. The returned value (if any) is printed.
Ordinarily, when you continue your program, you do so at the place where it stopped. You can instead continue at an address of your own choosing.
The most common occasion to use this feature is to back up--perhaps with more breakpoints set-over a portion of a program that has already executed, in order to examine its execution in more detail.
To set the execution position to the current location, use Set
Execution Position from the breakpoint popup menu. This item is also
accessible by pressing and holding the Break/Clear
button.23
As a quicker alternative, you can also press mouse button 1 on
the arrow and drag it to a different location.24
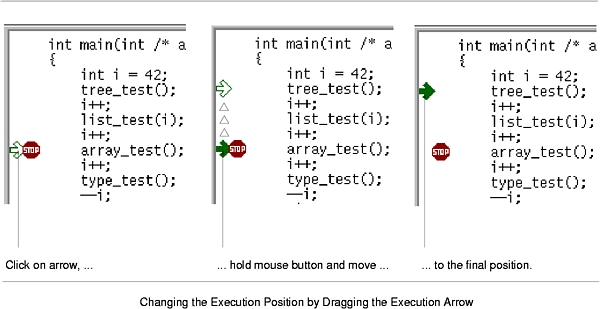
Moving the execution position does not change the current stack frame, or the stack pointer, or the contents of any memory location or any register other than the program counter.
Some inferior debuggers (notably GDB) allow you to set the new execution position into a different function from the one currently executing. This may lead to bizarre results if the two functions expect different patterns of arguments or of local variables. For this reason, moving the execution position requests confirmation if the specified line is not in the function currently executing.
After moving the execution position, click on Continue to resume
execution.
When your program has stopped, the first thing you need to know is where it stopped and how it got there.
Each time your program performs a function call, information about the call is generated. That information includes the location of the call in your program, the arguments of the call, and the local variables of the function being called. The information is saved in a block of data called a stack frame. The stack frames are allocated in a region of memory called the call stack.
When your program stops, the DDD commands for examining the stack allow you to see all of this information.
One of the stack frames is selected by DDD and many DDD commands refer implicitly to the selected frame. In particular, whenever you ask DDD for the value of a variable in your program, the value is found in the selected frame. There are special DDD commands to select whichever frame you are interested in.
The call stack is divided up into contiguous pieces called stack frames, or frames for short; each frame is the data associated with one call to one function. The frame contains the arguments given to the function, the function's local variables, and the address at which the function is executing.
When your program is started, the stack has only one frame, that of the
function main. This is called the initial frame or the
outermost frame. Each time a function is called, a new frame is
made. Each time a function returns, the frame for that function invocation
is eliminated. If a function is recursive, there can be many frames for
the same function. The frame for the function in which execution is
actually occurring is called the innermost frame. This is the most
recently created of all the stack frames that still exist.
Inside your program, stack frames are identified by their addresses. A stack frame consists of many bytes, each of which has its own address; each kind of computer has a convention for choosing one byte whose address serves as the address of the frame. Usually this address is kept in a register called the frame pointer register while execution is going on in that frame.
GDB assigns numbers to all existing stack frames, starting with zero for the innermost frame, one for the frame that called it, and so on upward. These numbers do not really exist in your program; they are assigned by GDB to give you a way of designating stack frames in GDB commands.
DDD provides a backtrace window showing a summary of how your program got where it is. It shows one line per frame, for many frames, starting with the currently executing frame (frame zero), followed by its caller (frame one), and on up the stack.
To enable the backtrace window, select Status =>
Backtrace.
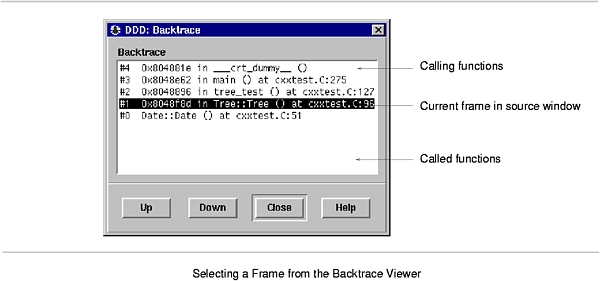
Using GDB, each line in the backtrace shows the frame number and the
function name. The program counter value is also shown--unless you use
the GDB command set print address off. The backtrace also shows
the source file name and line number, as well as the arguments to the
function. The program counter value is omitted if it is at the
beginning of the code for that line number.
Most commands for examining the stack and other data in your program work on whichever stack frame is selected at the moment. Here are the commands for selecting a stack frame.25
In the backtrace window, you can select an arbitrary frame to move from one stack frame to another. Just click on the desired frame.
The Up button selects the function that called the current
one--that is, it moves one frame up.
The Down button selects the function that was called by
the current one--that is, it moves one frame down.
You can also directly type the up and down commands at
the debugger prompt. Typing <Ctrl+Up> and <Ctrl+Down>,
respectively, will also move you through the stack.
Up and Down actions can be undone via Edit =>
Undo.
If you take a look at the Edit => Undo menu item after an
execution command, you'll find that DDD offers you to undo
execution commands just as other commands. Does this mean that
DDD allows you to go backwards in time, undoing program
execution as well as undoing any side-effects of your program?
Sorry--we must disappoint you. DDD cannot undo what your program did. (After a little bit of thought, you'll find that this would be impossible in general.) However, DDD can do something different: it can show previously recorded states of your program.
After "undoing" an execution command (via
Edit => Undo, or the Undo button), the execution
position moves back to the earlier position and displayed variables
take their earlier values. Your program state is in fact unchanged,
but DDD gives you a view on the earlier state as recorded by
DDD.
In this so-called historic mode, most normal DDD
commands that would query further information from the program are
disabled, since the debugger cannot be queried for the earlier state.
However, you can examine the current execution position, or the
displayed variables. Using Undo and Redo, you can
move back and forward in time to examine how your program got into the
present state.
To let you know that you are operating in historic mode, the execution arrow gets a dashed-line appearance (indicating a past position); variable displays also come with dashed lines. Furthermore, the status line informs you that you are seeing an earlier program state.
Here's how historic mode works: each time your program stops, DDD collects the current execution position and the values of displayed variables. Backtrace, thread, and register information is also collected if the corresponding dialogs are open. When "undoing" an execution command, DDD updates its view from this collected state instead of querying the program.
If you want to collect this information without interrupting your
program--within a loop, for instance--you can place a breakpoint with
an associated cont command (see Breakpoint Commands).
When the breakpoint is hit, DDD will stop, collect the data, and
execute the cont command, resuming execution. Using a later
Undo, you can step back and look at every single loop iteration.
To leave historic mode, you can use Redo until you are back in
the current program state. However, any DDD command that
refers to program state will also leave historic mode immediately by
applying to the current program state instead. For instance,
Up leaves historic mode immediately and selects an alternate
frame in the restored current program state.
If you want to see the history of a specific variable, as recorded during program stops, you can enter the DDD command
graph history name
This returns a list of all previously recorded values of the variable name, using array syntax. Note that name must have been displayed at earlier program stops in order to record values.
In some operating systems, a single program may have more than one thread of execution. The precise semantics of threads differ from one operating system to another, but in general the threads of a single program are akin to multiple processes--except that they share one address space (that is, they can all examine and modify the same variables). On the other hand, each thread has its own registers and execution stack, and perhaps private memory.
For debugging purposes, DDD lets you display the list of threads
currently active in your program and lets you select the current
thread--the thread which is the focus of debugging. DDD shows
all program information from the perspective of the current
thread.26
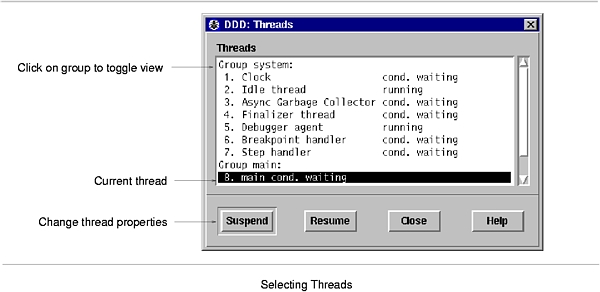
To view all currently active threads in your program, select
Status => Threads. The current thread is highlighted.
Select any thread to make it the current thread.
Using JDB, additional functionality is available:
Suspend to suspend execution of the selected threads;
Resume to resume execution of the selected threads.
For more information on threads, see the JDB and GDB documentation (see Threads).
A signal is an asynchronous event that can happen in a program. The
operating system defines the possible kinds of signals, and gives each
kind a name and a number. For example, in UNIX, SIGINT is the
signal a program gets when you type an interrupt; SIGSEGV is
the signal a program gets from referencing a place in memory far away
from all the areas in use; SIGALRM occurs when the alarm clock
timer goes off (which happens only if your program has requested an
alarm).
Some signals, including SIGALRM, are a normal part of the
functioning of your program. Others, such as SIGSEGV, indicate
errors; these signals are fatal (kill your program immediately)
if the program has not specified in advance some other way to handle the
signal. SIGINT does not indicate an error in your program, but
it is normally fatal so it can carry out the purpose of the interrupt:
to kill the program.
GDB has the ability to detect any occurrence of a signal in your program. You can tell GDB in advance what to do for each kind of signal.
Normally, DDD is set up to ignore non-erroneous signals like
SIGALRM (so as not to interfere with their role in the
functioning of your program) but to stop your program immediately
whenever an error signal happens. In DDD, you can view and edit
these settings via Status => Signals.
Status => Signals pops up a panel showing all the kinds of
signals and how GDB has been told to handle each one. The settings
available for each signal are:
Stop
Print being set.
Print
If unset, GDB should not mention the occurrence of the signal at all.
This also implies Stop being unset.
Pass
If unset, GDB should not allow your program to see this signal.
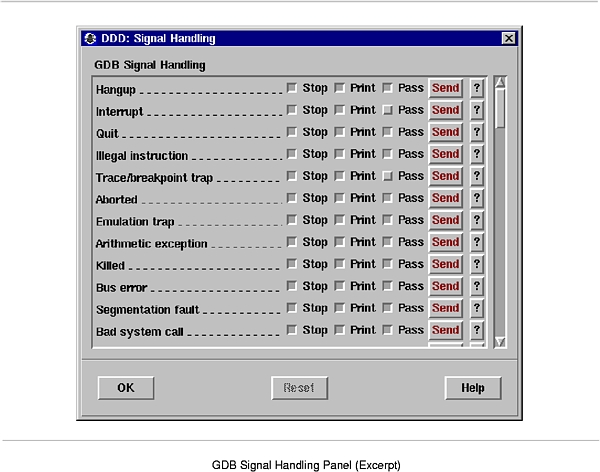
The entry All Signals is special. Changing a setting here
affects all signals at once--except those used by the debugger,
typically SIGTRAP and SIGINT.
To undo any changes, use Edit => Undo. The Reset
button restores the saved settings.
When a signal stops your program, the signal is not visible until you
continue. Your program sees the signal then, if Pass is in
effect for the signal in question at that time. In other words,
after GDB reports a signal, you can change the Pass setting in
Status => Signals to control whether your program sees
that signal when you continue.
You can also cause your program to see a signal it normally would not
see, or to give it any signal at any time. The Send button will
resume execution where your program stopped, but immediately give it the
signal shown.
On the other hand, you can also prevent your program from seeing a
signal. For example, if your program stopped due to some sort of memory
reference error, you might store correct values into the erroneous
variables and continue, hoping to see more execution; but your program
would probably terminate immediately as a result of the fatal signal
once it saw the signal. To prevent this, you can resume execution using
Commands => Continue Without Signal.
Edit => Save Options does not save changed signal
settings, since changed signal settings are normally useful within
specific projects only. Instead, signal settings are saved with the
current session, using File => Save Session As.
You can kill the process of the debugged program at any time using the
Kill button.
Killing the process is useful if you wish to debug a core dump instead of a running process. GDB ignores any core dump file while your program is running.
The Kill button is also useful if you wish to recompile and
relink your program, since on many systems it is impossible to modify an
executable file while it is running in a process. In this case, when
you next click on Run, GDB notices that the file has changed, and
reads the symbol table again (while trying to preserve your current
debugger state).
DDD provides several means to examine data.
To display the value of a simple variable, move the mouse pointer on its
name. After a second, a small window (called value tip) pops up
showing the value of the variable pointed at. The window disappears as
soon as you move the mouse pointer away from the variable. The value is
also shown in the status line.
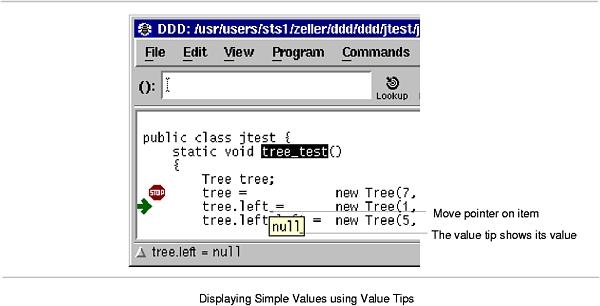
You can disable value tips via Edit => Preferences
=> General => Automatic display of variable values as
popup tips.
You can disable displaying variable values in the status line via
Edit => Preferences => General => Automatic
display of variable values in the status line.
These customizations are tied to the following resources:
| valueTips (class Tips) | Resource |
Whether value tips are enabled (on, default) or not
(off). Value tips affect DDD performance and may
be distracting for some experienced users.
|
| valueDocs (class Docs) | Resource |
Whether the display of variable values in the status line is enabled
(on, default) or not (off).
|
You can turn off value tips via Edit => Preferences
=> General => Automatic Display of Variable Values.
The variable value can also be printed in the debugger console, making
it available for future operations. To print a variable value, select
the desired variable by clicking mouse button 1 on its name. The
variable name is copied to the argument field. By clicking the
Print button, the value is printed in the debugger console. The
printed value is also shown in the status line.
As a shorter alternative, you can simply press mouse button 3 on
the variable name and select the Print item from the popup menu.
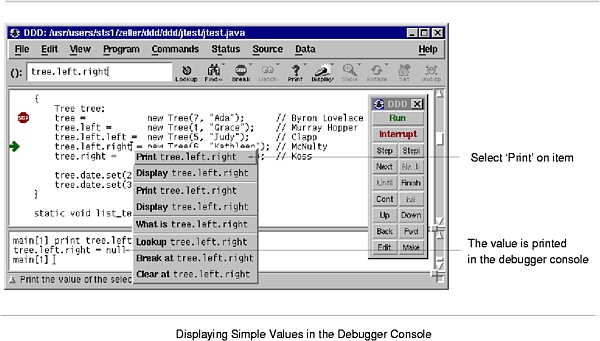
In GDB, the Print button generates a print command, which
has several more options. See Data, for GDB-specific expressions, variables, and
output formats.
To explore complex data structures, you can display them permanently in the data window. The data window displays selected data of your program, showing complex data structures graphically. It is updated each time the program stops.
This section discusses how to create, manipulate, and delete displays. The essentials are:
Display to display the variable in ().
Undisplay to delete the selected display.
To create a new display showing a specific variable, select the variable
by clicking mouse button 1 on its name. The variable name is
copied to the argument field. By clicking the Display button, a
new display is created in the data window. The data window opens
automatically as soon as you create a display.
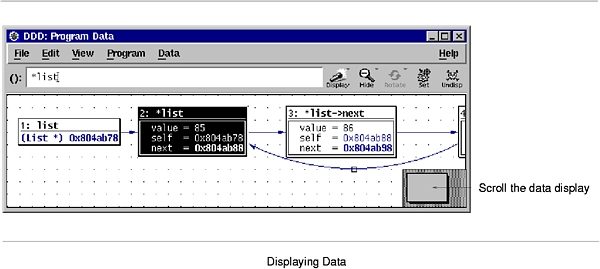
As a shorter alternative, you can simply press mouse button 3 on
the variable name and select Display from the popup menu.
As an even faster alternative, you can also double-click on the variable name.
As another alternative, you may also enter the expression to be
displayed in the argument field and press the Display button.
Finally, you may also type in a command at the debugger prompt:
graph display expr [clustered] [at (x, y)]
[dependent on display] [[now or] when in scope]
This command creates a new display showing the value of the expression expr. The optional parts have the following meaning:
clustered
at (x, y)
dependent on display
when in scope
now or when in scope
when in is given, the display creation is deferred until
execution reaches the given scope (a function name, as in the
backtrace output).
If now or when in is given, DDD first attempts to create
the display immediately. The display is deferred only if display
creation fails.
If neither when in suffix nor now or when in suffix is
given, the display is created immediately.
Each display in the data window has a title bar containing the display number and the displayed expression (the display name). Below the title, the display value is shown.
You can select single displays by clicking on them with mouse button 1.
You can extend an existing selection by pressing the <Shift> key while selecting. You can also toggle an existing selection by pressing the <Shift> key while selecting already selected displays.
Single displays may also be selected by using the arrow keys <Up>, <Down>, <Left>, and <Right>.
Multiple displays are selected by pressing and holding mouse button 1 somewhere on the window background. By moving the pointer while holding the button, a selection rectangle is shown; all displays fitting in the rectangle are selected when mouse button 1 is released.
If the <Shift> key is pressed while selecting, the existing selection is extended.
By double-clicking on a display title, the display itself and all
connected displays are automatically selected.
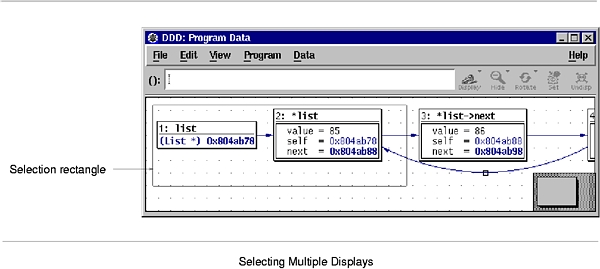
Aggregate values (i.e. records, structs, classes, and arrays) can be
shown expanded, that is, displaying all details, or
hidden, that is, displayed as {...}.
To show details about an aggregate, select the aggregate by clicking
mouse button 1 on its name or value and click on the Show
button. Details are shown for the aggregate itself as well as for all
contained sub-aggregates.
To hide details about an aggregate, select the aggregate by clicking
mouse button 1 on its name or value and click on the Hide
button.
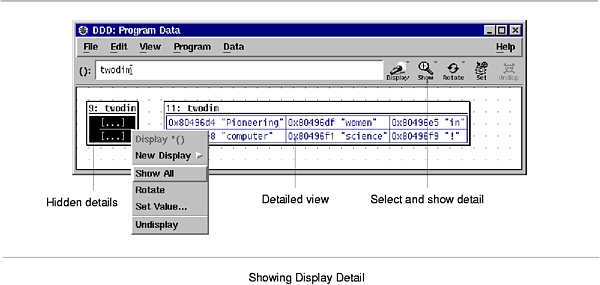
When pressing and holding mouse button 1 on the Show/Hide
button, a menu pops up with even more alternatives:
Show More ()
Show Just ()
Show All ()
Show button.
Hide ()
Hide button.
As a faster alternative, you can also press mouse button 3 on the aggregate and select the appropriate menu item.
As an even faster alternative, you can also double-click mouse button 1 on a value. If some part of the value is hidden, more details will be shown; if the entire value is shown, double-clicking will hide the value instead. This way, you can double-click on a value until you get the right amount of details.
If all details of a display are hidden, the display is called
disabled; this is indicated by the string (Disabled).
Displays can also be disabled or enabled via a DDD command, which you enter at the debugger prompt:
graph disable display displays...
disables the given displays.
graph enable display displays...
re-enables the given displays.
In both commands, displays... is either
Use Edit => Undo to undo disabling or enabling displays.
Arrays, structures and lists can be oriented horizontally or vertically.
To change the orientation of a display, select it and then click on the
Rotate button.
As a faster alternative, you can also press mouse button 3 on the
array and select Rotate from the popup menu.
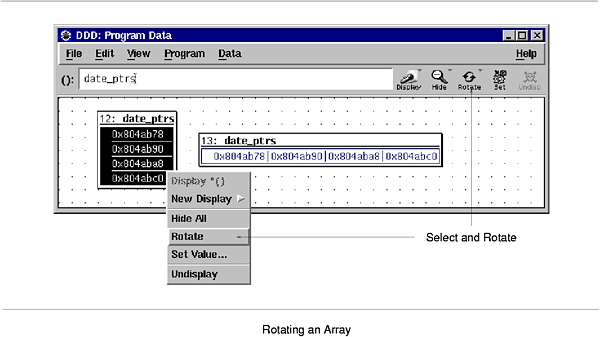
If a structure or list is oriented horizontally, DDD automatically suppresses the member names. This can be handy for saving space.
The last chosen display orientation is used for the creation of new
displays. If you recently rotated an array to horizontal orientation,
the next array you create will also be oriented horizontally. These
settings are saved with Edit => Save Options; they are
tied to the following resources:
| arrayOrientation (class Orientation) | Resource |
How arrays are to be oriented. Possible values are XmVERTICAL
(default) and XmHORIZONTAL.
|
| showMemberNames (class ShowMemberNames) | Resource |
Whether to show struct member names or not. Default is on.
|
| structOrientation (class Orientation) | Resource |
How structs are to be oriented. Possible values are XmVERTICAL
(default) and XmHORIZONTAL.
|
You can display all local variables at once by choosing Data
=> Display Local Variables. When using DBX, XDB, JDB, or Perl,
this displays all local variables, including the arguments of the
current function. When using GDB or PYDB, function arguments are
contained in a separate display, activated by Data =>
Display Arguments.
The display showing the local variables can be manipulated just like any
other data display. Individual variables can be selected and
dereferenced.
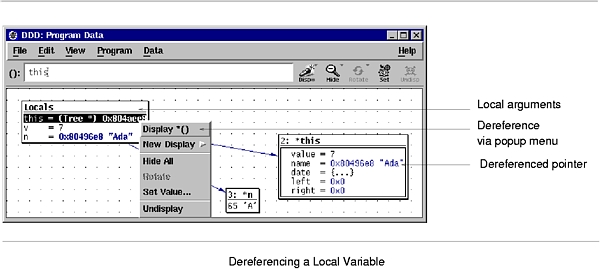
You can create a display from the output of an arbitrary debugger command. By entering
graph display `command`
the output of command is turned into a status display updated each time the program stops.
For instance, the command
graph display `where`
creates a status display named Where that shows the current
backtrace.
If you are using GDB, DDD provides a panel from which you can
choose useful status displays. Select Data => Status
Displays and pick your choice from the list.
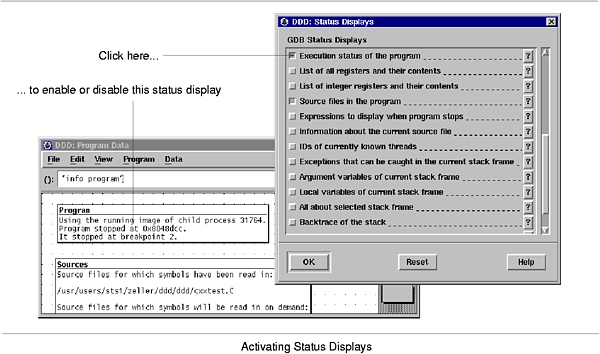
Refreshing status displays at each stop takes time; you should delete status displays as soon as you don't need them any more.
The data window is automatically updated or refreshed each time the program stops. Values that have changed since the last refresh are highlighted.
However, there may be situations where you should refresh the data window explicitly. This is especially the case whenever you changed debugger settings that could affect the data format, and want the data window to reflect these settings.
You can refresh the data window by selecting Data =>
Refresh Displays.
As an alternative, you can press mouse button 3 on the background
of the data window and select the Refresh Displays item.
Typing
graph refresh
at the debugger prompt has the same effect.
If you examine several variables at once, having a separate display for each of them uses a lot of screen space. This is why DDD supports clusters. A cluster merges several logical data displays into one physical display, saving screen space.
There are two ways to create clusters:
Undisp => Cluster
(). This creates a new cluster from all selected displays. If an
already existing cluster is selected, too, the selected displays will be
clustered into the selected cluster.
Edit =>
Preferences => Data => Cluster Data Displays.
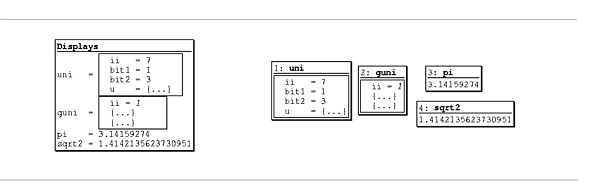
Displays in a cluster can be selected and manipulated like parts of an ordinary display; in particular, you can show and hide details, or dereference pointers. However, edges leading to clustered displays can not be shown, and you must either select one or all clustered displays.
Disabling a cluster is called unclustering, and again, there are two ways of doing it:
Undisp => Uncluster ().
Edit => Preferences => Data => Cluster Data
Displays.
To display several successive objects of the same type (a section of an
array, or an array of dynamically determined size), you can use the
notation from..to in display expressions.
from and to are numbers that denote the first and last expression to display. Thus,
graph display argv[0..9]
creates 10 new displays for argv[0], argv[1], ...,
argv[9]. The displays are clustered automatically
(see Clustering), such that you can easily handle the set just like
an array.
The from..to notation can also be used multiple
times. For instance,
graph display 1..5 * 1..5
creates a handy small multiplication table.
The from..to notation creates several displays, which
takes time to create and update. If you want to display only a part of
an array, array slices are a more efficient way. See Array Slices, for a discussion.
You can view the state of all displays by selecting Data =>
Displays. This invokes the Display Editor.
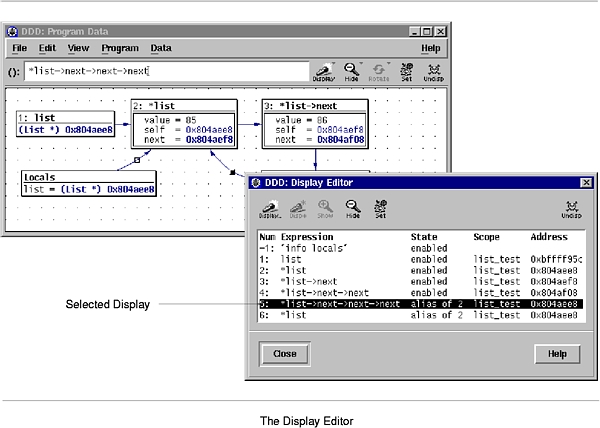
The Display Editor shows the properties of each display, using the following fields:
Num
Expression
State
enabled
disabled
Show to enable.
not active
deferred
Scope is reached (see Creating Single Displays).
clustered
Undisp =>
Uncluster to uncluster.
alias of display
Scope
Address
To delete a single display, select it and click on the Undisp
button. As an alternative, you can also press mouse button 3 on
the display and select the Undisplay item.
When a display is deleted, its immediate ancestors and descendants are automatically selected, so that you can easily delete entire graphs.
To delete several displays at once, use the Undisp button in the
Display Editor (invoked via Data => Displays). Select any
number of display items in the usual way and delete them by pressing
Undisp.
As an alternative, you can also use a DDD command:
graph undisplay displays...
Here, displays... is either
If you are using stacked windows, deleting the last display from the
data window also automatically closes the data window. (You can change
this via Edit => Preferences => Data => Close
data window when deleting last display.)
If you deleted a display by mistake, use Edit => Undo to
re-create it.
Finally, you can also cut, copy, and paste displays using the
Cut, Copy, and Paste items from the Edit
menu. The clipboard holds the commands used to create the
displays; Paste inserts the display commands in the debugger
console. This allows you to save displays for later usage or to copy
displays across multiple DDD instances.
You can use these resources to control display appearance:
| autoCloseDataWindow (class AutoClose) | Resource |
If this is on (default) and DDD is in stacked window
mode, deleting the last display automatically closes the data window.
If this is off, the data window stays open even after deleting
the last display.
|
| bumpDisplays (class BumpDisplays) | Resource |
If some display d changes size and this resource is on
(default), DDD assigns new positions to displays below and on
the right of d such that the distance between displays remains
constant. If this is off, other displays are not rearranged.
|
| clusterDisplays (class ClusterDisplays) | Resource |
If on, new independent data displays will automatically be
clustered. Default is off, meaning to leave new displays
unclustered.
|
| hideInactiveDisplays (class HideInactiveDisplays) | Resource |
If some display gets out of scope and this resource is on
(default), DDD removes it from the data display. If this is
off, it is simply disabled.
|
| showBaseDisplayTitles (class ShowDisplayTitles) | Resource |
Whether to assign titles to base (independent) displays or not.
Default is on.
|
| showDependentDisplayTitles (class ShowDisplayTitles) | Resource |
Whether to assign titles to dependent displays or not. Default is
off.
|
DDD has some special features that facilitate handling of arrays.
It is often useful to print out several successive objects of the same type in memory; a slice (section) of an array, or an array of dynamically determined size for which only a pointer exists in the program.
Using DDD, you can display slices using the
from..to notation (see Creating Multiple Displays). But this requires that you already know from and
to; it is also inefficient to create several single displays. If
you use GDB, you have yet another alternative.
Using GDB, you can display successive objects by referring to a
contiguous span of memory as an artificial array, using the binary
operator @. The left operand of @ should be the first
element of the desired array and be an individual object. The right
operand should be the desired length of the array. The result is an
array value whose elements are all of the type of the left argument.
The first element is actually the left argument; the second element
comes from bytes of memory immediately following those that hold the
first element, and so on.
Here is an example. If a program says
int *array = (int *) malloc (len * sizeof (int));
you can print the contents of array with
print array[0]@len
and display the contents with
graph display array[0]@len
The general form of displaying an array slice is thus
graph display array[first]@nelems
where array is the name of the array to display, first is the index of the first element, and nelems is the number of elements to display.
The left operand of @ must reside in memory. Array values made
with @ in this way behave just like other arrays in terms of
subscripting, and are coerced to pointers when used in expressions.
Using GDB, an array value that is repeated 10 or more times is displayed
only once. The value is shown with a <nx> postfix added,
where n is the number of times the value is repeated. Thus, the
display 0x0 <30x> stands for 30 array elements, each with the
value 0x0. This saves a lot of display space, especially with
homogeneous arrays.
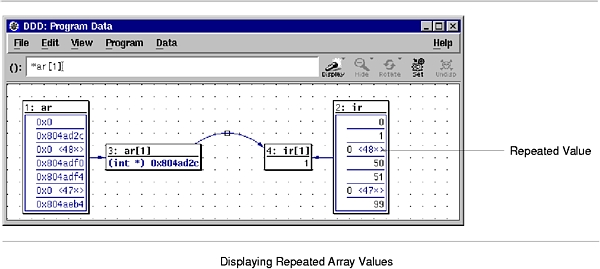
The default GDB threshold for repeated array values is 10. You can
change it via Edit => GDB Settings => Threshold for
repeated print elements. Setting the threshold to 0 will cause
GDB (and DDD) to display each array element individually. Be
sure to refresh the data window via Data => Refresh
Displays after a change in GDB settings.
You can also configure DDD to display each array element individually:
| expandRepeatedValues (class ExpandRepeatedValues) | Resource |
GDB can print repeated array elements as value <repeated
n times>. If expandRepeatedValues is on,
DDD will display n instances of value instead. If
expandRepeatedValues is off (default), DDD will
display value with <nx> appended to indicate the
repetition.
|
By default, DDD lays out two-dimensional arrays as tables, such
that all array elements are aligned with each other.27 To disable
this feature, unset Edit => Preferences => Data
=> Display Two-Dimensional Arrays as Tables. This is tied to
the following resource:
| align2dArrays (class Align2dArrays) | Resource |
If on (default), DDD lays out two-dimensional arrays
as tables, such that all array elements are aligned with each other.
If off, DDD treats a two-dimensional array as an
array of one-dimensional arrays, each aligned on its own.
|
During program execution, you can change the values of arbitrary variables.28
To change the value of a variable, enter its name in ()--for
instance, by selecting an occurrence or a display. Then, click on the
Set button. In a dialog, you can edit the variable value at
will; clicking the OK or Apply button commits your change
and assigns the new value to the variable.
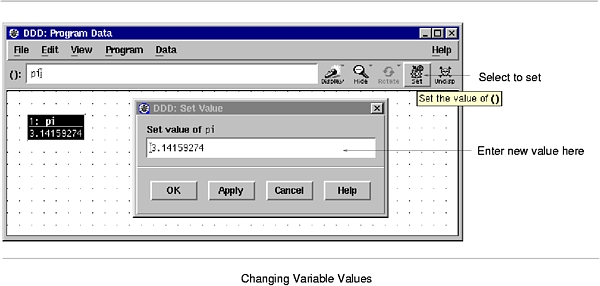
To change a displayed value, you can also select Set Value menu
from the data popup menu,
If you made a mistake, you can use Edit => Undo to re-set
the variable to its previous value.
Besides displaying simple values, DDD can also visualize the Dependencies between values--especially pointers and other references that make up complex data structures.
Dependent displays are created from an existing display. The dependency is indicated by an edge leading from the originating display to the dependent display.
To create a dependent display, select the originating display or display
part and enter the dependent expression in the (): argument
field. Then click on the Display button.
Using dependent displays, you can investigate the data structure of a tree for example and lay it out according to your intuitive image of the tree data structure.
By default, DDD does not recognize shared data structures (i.e. a data object referenced by multiple other data objects). See Shared Structures, for details on how to examine such structures.
There are special shortcuts for creating dependent displays showing the value of a dereferenced pointer. This allows for rapid examination of pointer-based data structures.
To dereference a pointer, select the originating pointer value or name
and click on the Disp * button. A new display showing the
dereferenced pointer value is created.
As a faster alternative, you can also press mouse button 3 on the
originating pointer value or name and select the Display * menu
item.
As an even faster alternative, you can also double-click mouse button 1 on the originating pointer value or name. If you press <Ctrl> while double-clicking, the display will be dereferenced in place-that is, it will be replaced by the dereferenced display.
The Display *() function is also accessible by pressing and
holding the Display button.
By default, DDD does not recognize shared data structures--that
is, a data object referenced by multiple other data objects. For
instance, if two pointers p1 and p2 point at the same data
object d, the data displays d, *p1, and *p2
will be separate, although they denote the same object.
DDD provides a special mode which makes it detect these
situations. DDD recognizes if two or more data displays are
stored at the same physical address, and if this is so, merges all these
aliases into one single data display, the original data
display. This mode is called Alias Detection; it is enabled via
Data => Detect Aliases.
When alias detection is enabled, DDD inquires the memory location (the address) of each data display after each program step. If two displays have the same address, they are merged into one. More specifically, only the one which has least recently changed remains (the original data display); all other aliases are suppressed, i.e. completely hidden. The edges leading to the aliases are replaced by edges leading to the original data display.
An edge created by alias detection is somewhat special: rather than connecting two displays directly, it goes through an edge hint, describing an arc connecting the two displays and the edge hint.
Each edge hint is a placeholder for a suppressed alias; selecting an
edge hint is equivalent to selecting the alias. This way, you can
easily delete display aliases by simply selecting the edge hint and
clicking on Undisp.
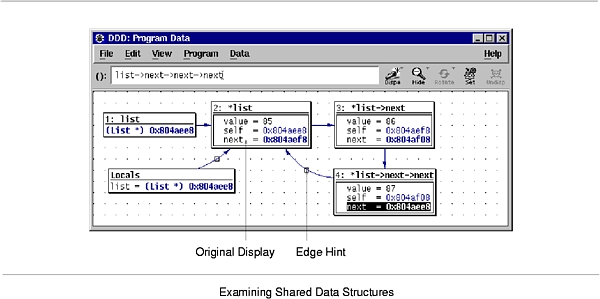
To access suppressed display aliases, you can also use the Display Editor. Suppressed displays are listed in the Display Editor as aliases of the original data display. Via the Display Editor, you can select, change, and delete suppressed displays.
Suppressed displays become visible again as soon as
Please note the following caveats with alias detection:
&p (unless p actually points to
itself). You can also examine the data display addresses, as shown in
the Display Editor.
Alias detection is controlled by the following resources:
| deleteAliasDisplays (class DeleteAliasDisplays) | Resource |
If this is on (default), the Undisplay () button also
deletes all aliases of the selected displays. If this is off,
only the selected displays are deleted; the aliases remain, and one of
the aliases will be unsuppressed.
|
| detectAliases (class DetectAliases) | Resource |
If on, DDD attempts to recognize shared data structures.
The default is off, meaning that shared data structures are not
recognized.
|
| typedAliases (class TypedAliases) | Resource |
If on (default), DDD requires structural equivalence in
order to recognize shared data structures. If this is off, two
displays at the same address are considered aliases, regardless of their
structure.
|
DDD maintains a shortcut menu of frequently used display expressions. This menu is activated
Display button, or
New Display, or
By default, the shortcut menu contains frequently used base conversions.
The Other entry in the shortcut menu lets you create a new
display that extends the shortcut menu.
As an example, assume you have selected a display named date_ptr.
Selecting Display => Other pops up a dialog that allows
you to enter a new expression to be displayed--for instance, you can
cast the display date_ptr to a new display (char
*)date_ptr. If the Include in toggle
was activated, the shortcut menu will then contain a new entry
New Display MenuDisplay (char *)() that will cast any selected display
display to (char *)display. Such shortcuts can save
you a lot of time when examining complex data structures.
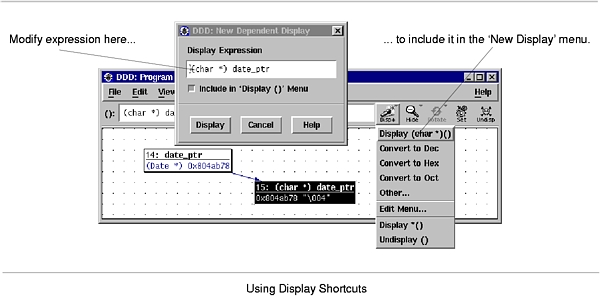
You can edit the contents of the New Display menu by selecting
its Edit Menu item. This pops up the Shortcut Editor
containing all shortcut expressions, which you can edit at leisure.
Each line contains the expression for exactly one menu item. Clicking
on Apply re-creates the New Display menu from the text.
If the text is empty, the New Display menu will be empty, too.
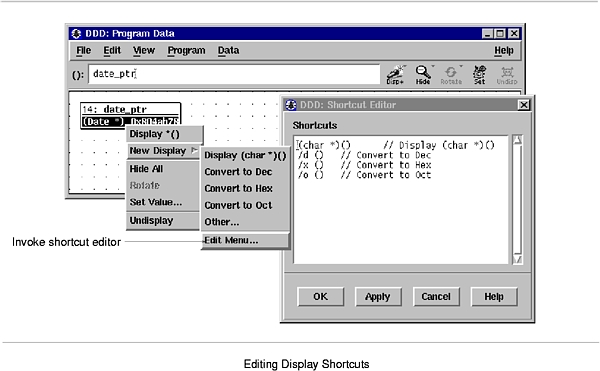
DDD also allows you to specify individual labels for
user-defined buttons. You can write such a label after the expression,
separated by //. This feature is used in the default contents of
the GDB New Display menu, where each of the base conversions has
a label:
/t () // Convert to Bin /d () // Convert to Dec /x () // Convert to Hex /o () // Convert to Oct
Feel free to add other conversions here. DDD supports up to 20
New Display menu items.
The shortcut menu is controlled by the following resources:
| dbxDisplayShortcuts (class DisplayShortcuts) | Resource |
A newline-separated list of display expressions to be included in the
New Display menu for DBX.
If a line contains a label delimiter29, the string before the delimiter is used as
expression, and the string after the delimiter is used as label.
Otherwise, the label is |
| gdbDisplayShortcuts (class DisplayShortcuts) | Resource |
A newline-separated list of display expressions to be included in the
New Display menu for GDB. See the description of
dbxDisplayShortcuts, above.
|
| jdbDisplayShortcuts (class DisplayShortcuts) | Resource |
A newline-separated list of display expressions to be included in the
New Display menu for JDB. See the description of
dbxDisplayShortcuts, above.
|
| perlDisplayShortcuts (class DisplayShortcuts) | Resource |
A newline-separated list of display expressions to be included in the
New Display menu for Perl. See the description of
dbxDisplayShortcuts, above.
|
| pydbDisplayShortcuts (class DisplayShortcuts) | Resource |
A newline-separated list of display expressions to be included in the
New Display menu for PYDB. See the description of
dbxDisplayShortcuts, above.
|
| xdbDisplayShortcuts (class DisplayShortcuts) | Resource |
A newline-separated list of display expressions to be included in the
New Display menu for XDB. See the description of
dbxDisplayShortcuts, above.
|
If you have several displays at once, you may wish to arrange them according to your personal preferences. This section tells you how you can do this.
From time to time, you may wish to move displays at another place in the data window. You can move a single display by pressing and holding mouse button 1 on the display title. Moving the pointer while holding the button causes all selected displays to move along with the pointer.
Edge hints can be selected and moved around like other displays. If an arc goes through the edge hint, you can change the shape of the arc by moving the edge hint around.
For fine-grain movements, selected displays may also be moved using the arrow keys. Pressing <Shift> and an arrow key moves displays by single pixels. Pressing <Ctrl> and arrow keys moves displays by grid positions.
If the data window becomes too small to hold all displays, scroll bars are created. If your DDD is set up to use panners instead, a panner is created in the lower right edge. When the panner is moved around, the window view follows the position of the panner.
To change from scroll bars to panners, use Edit => Startup
=> Data Scrolling and choose either Panner or
Scrollbars.
This setting is tied to the following resource:
| pannedGraphEditor (class PannedGraphEditor) | Resource |
The control to scroll the graph.
See Options, for the |
You can align all displays on the nearest grid position by selecting
Data => Align on Grid. This is useful for keeping edges
strictly horizontal or vertical.
You can enforce alignment by selecting Edit => Preferences
=> Data => Auto-align Displays on Nearest Grid Point. If
this feature is enabled, displays can be moved on grid positions only.
You can layout the entire graph as a tree by selecting Data
=> Layout Graph.
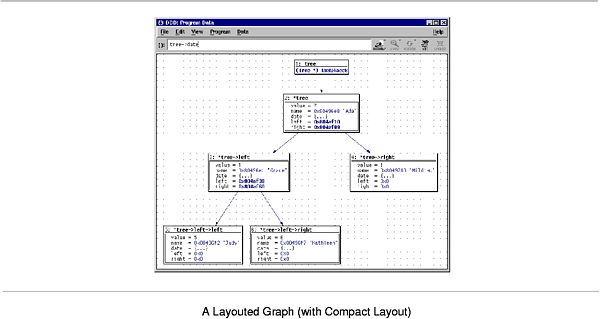
Layouting the graph may introduce edge hints; that is, edges are no more straight lines, but lead to an edge hint and from there to their destination. Edge hints can be moved around like arbitrary displays.
To enable a more compact layout, you can set the Edit =>
Preferences => Data => Compact Layout option. This
realizes an alternate layout algorithm, where successors are placed next
to their parents. This algorithm is suitable for homogeneous data
structures only.
You can enforce layout by setting Edit => Preferences
=> Data => Automatic Layout. If automatic layout is
enabled, the graph is layouted after each change.
You can rotate the entire graph clockwise by 90 degrees by selecting
Data => Rotate Graph.
If the graph was previously layouted, you may need to layout it again. Subsequent layouts will respect the direction of the last rotation.
DDD allows for printing the graph picture on PostScript printers
or into files. This is useful for documenting program states.
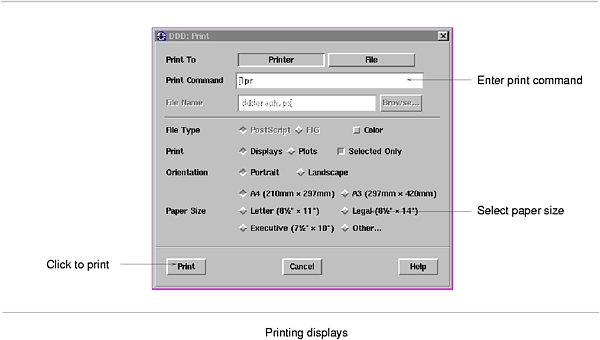
To print the graph on a PostScript printer, select File =>
Print Graph. Enter the printing command in the Print Command
field. Click on the OK or the Apply button to start
printing.
As an alternative, you may also print the graph in a file. Click on the
File button and enter the file name in the File Name
field. Click on the Print button to create the file.
When the graph is printed in a file, two formats are available:
PostScript--suitable for enclosing the graph in another
document;
FIG--suitable for post-processing, using the xfig
graphic editor, or for conversion into other formats (among others,
IBMGL, TeX, PIC), using the transfig or
fig2dev programs.
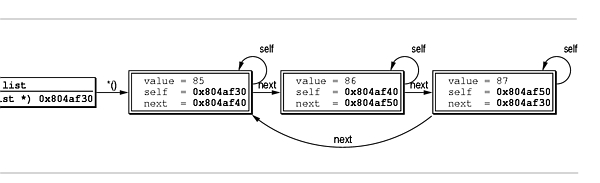
Please note the following caveats related to printing graphs:
Print dialog, the
option Selected Only is set. This makes DDD print only
the selected displays.
Color, Orientation, and Paper Size options are
meaningful for PostScript only.
These settings are tied to the following resources:
| printCommand (class PrintCommand) | Resource |
The command to print a PostScript file. Usually lp or
lpr.
|
| paperSize (class PaperSize) | Resource |
The paper size used for printing, in format width x
height. The default is ISO A4 format, or 210mm x 297mm.
|
This section discusses how DDD actually creates displays from data.
All data displayed in the DDD data window is maintained by the
inferior debugger. GDB, for instance, provides a display list,
holding symbolic expressions to be evaluated and printed on standard
output at each program stop. The GDB command display tree adds
tree to the display list and makes GDB print the value of
tree as, say, tree = (Tree *)0x20e98, at each program
stop. This GDB output is processed by DDD and displayed in the
data window.
Each element of the display list, as transmitted by the inferior debugger, is read by DDD and translated into a box. Boxes are rectangular entities with a specific content that can be displayed in the data window. We distinguish atomic boxes and composite boxes. An atomic box holds white or black space, a line, or a string. Composite boxes are horizontal or vertical alignments of other boxes. Each box has a size and an extent that determines how it fits into a larger surrounding space.
Through construction of larger and larger boxes, DDD constructs a graph node from the GDB data structure in a similar way a typesetting system like TeX builds words from letters and pages from paragraphs.
Such constructions are easily expressed by means of functions mapping boxes onto boxes. These display functions can be specified by the user and interpreted by DDD, using an applicative language called VSL for visual structure language. VSL functions can be specified by the DDD user, leaving much room for extensions and customization. A VSL display function putting a frame around its argument looks like this:
// Put a frame around TEXT frame(text) = hrule() | vrule() & text & vrule() | hrule();
Here, hrule() and vrule() are primitive functions
returning horizontal and vertical lines, respectively. The & and
| operators construct horizontal and vertical alignments fro
their arguments.
VSL provides basic facilities like pattern matching and variable numbers
of function arguments. The halign() function, for instance,
builds a horizontal alignment from an arbitrary number of arguments,
matched by three dots (...):
// Horizontal alignment halign(x) = x; halign(x, ...) = x & halign(...);
Frequently needed functions like halign() are grouped into a
standard VSL library.
To visualize data structures, each atomic type and each type constructor from the programming language is assigned a VSL display function. Atomic values like numbers, characters, enumerations, or character strings are displayed using string boxes holding their value; the VSL function to display them leaves them unchanged:
// Atomic Values simple_value(value) = value;
Composite values require more attention. An array, for instance, may be displayed using a horizontal alignment:
// Array array(...) = frame(halign(...));
When GDB sends DDD the value of an array, the VSL function
array() is invoked with array elements as values. A GDB array
expression {1, 2, 3} is thus evaluated in VSL as
array(simple_value("1"), simple_value("2"), simple_value("3"))
which equals
"1" & "2" & "3"
a composite box holding a horizontal alignment of three string boxes. The actual VSL function used in DDD also puts delimiters between the elements and comes in a vertical variant as well.
Nested structures like multi-dimensional arrays are displayed by
applying the array() function in a bottom-up fashion. First,
array() is applied to the innermost structures; the resulting
boxes are then passed as arguments to another array()
invocation. The GDB output
{{"A", "B", "C"}, {"D", "E", "F"}}
representing a 2 * 3 array of character strings, is evaluated in VSL as
array(array("A", "B", "C"), array("A", "B", "C"))
resulting in a horizontal alignment of two more alignments representing the inner arrays.
Record structures are built in a similar manner, using a display
function struct\_member rendering the record members. Names and
values are separated by an equality sign:
// Member of a record structure struct_member (name, value) = name & " = " & value;
The display function struct renders the record itself, using the
valign() function.30
// Record structure struct(...) = frame(valign(...));
This is a simple example; the actual VSL function used in DDD takes additional effort to align the equality signs; also, it ensures that language-specific delimiters are used, that collapsed structs are rendered properly, and so on.
DDD comes with a built-in VSL library that should suffice for most, if not all, purposes. Using the following resources, one can change and enhance the VSL definitions:
| vslBaseDefs (class VSLDefs) | Resource |
A string with additional VSL definitions that are appended to the
builtin VSL library. This resource is prepended to the vslDefs
resource below and set in the DDD application defaults file;
don't change it.
|
| vslDefs (class VSLDefs) | Resource |
|
A string with additional VSL definitions that are appended to the
builtin VSL library. The default value is an empty string. This
resource can be used to override specific VSL definitions that affect
the data display.
The general pattern to replace a function definition function with a new definition new_def is: #pragma replace function function(args...) = new_def; The following VSL functions are frequently used:
To set the pointer color to "red4", use Ddd*vslDefs: \ #pragma replace pointer_color\n\ pointer_color(box) = color(box, "red4");\n To set the default font size to resolution-independent 10.0 points, use Ddd*vslDefs: \ #pragma replace stdfontsize\n\ #pragma replace stdfontpoints\n\ stdfontsize() = 0;\n stdfontpoints() = 100;\n To set the default font to 12-pixel courier, use Ddd*vslDefs: \ #pragma replace stdfontsize\n\ #pragma replace stdfontfamily\n\ stdfontsize() = 12;\n\ stdfontfamily() = family_courier();\n See the file |
| vslLibrary (class VSLLibrary) | Resource |
The VSL library to use. builtin (default) means to
use the built-in library, any other value is used as file name.
|
| vslPath (class VSLPath) | Resource |
A colon-separated list of directories to search for VSL
include files. Default is ., the current directory.
|
If your DDD source distribution is installed in /opt/src,
you can use the following settings to read the VSL library from
/home/joe/ddd.vsl:
Ddd*vslLibrary: /home/joe/ddd.vsl Ddd*vslPath: .:/opt/src/ddd/ddd:/opt/src/ddd/vsllib
VSL include files referenced by /home/joe/ddd.vsl are searched
first in the current directory ., then in
/opt/src/ddd/ddd/, and then in /opt/src/ddd/vsllib/.
Instead of supplying another VSL library, it is often easier to specify
some minor changes to the built-in library. See the vslDefs
resource, above, for details.
If you have huge amounts of numerical data to examine, a picture often says more than a thousand numbers. Therefore, DDD allows you to draw numerical values in nice 2-D and 3-D plots.
Basically, DDD can plot two types of numerical values:
To plot a fixed-size array, select its name by clicking mouse
button 1 on an occurrence. The array name is copied to the argument
field. By clicking the Plot button, a new display is created in
the data window, followed by a new top-level window containing the value
plot.
To plot a dynamically sized array, you must use an array slice (see Array Slices). In the argument field, enter
array[first]@nelems
where array is the name of the array to display, first is
the index of the first element, and nelems is the number of
elements to display. Then, click on Plot to start the plot.
To plot a value, you can also enter a command at the debugger prompt:
graph plot expr
works like graph display expr (and takes the same
arguments; see Creating Single Displays), but the value is
additionally shown in the plot window.
Each time the value changes during program execution, the plot is
updated to reflect the current values. The plot window remains active
until you close it (via File => Close) or until the
associated display is deleted.
The actual drawing is not done by DDD itself. Instead,
DDD relies on an external gnuplot program to create the
drawing.
DDD adds a menu bar to the Gnuplot plot window that lets you influence the appearance of the plot:
View menu toggles optional parts of the plot, such as
border lines or a background grid.
Plot menu changes the plotting style. The 3-D
Lines option is useful for plotting two-dimensional arrays.
Scale menu allows you to enable logarithmic scaling and to
enable or disable the scale tics.
Contour menu adds contour lines to 3-D plots.
In a 3-D plot, you can use the scroll bars to change your view position.
The horizontal scroll bar rotates the plot around the z axis, that
is, to the left and right. The vertical scroll bar rotates the plot
around the y axis, that is, up and down.
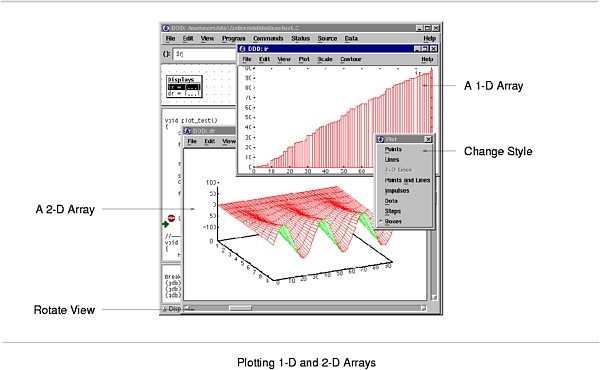
You can also resize the plot window as desired.
Besides plotting arrays, DDD also allows you to plot scalars
(simple numerical values). This works just like plotting arrays--you
select the numerical variable, click on Plot, and here comes the
plot. However, plotting a scalar is not very exciting. A plot that
contains nothing but a scalar simply draws the scalar's value as a
y constant--that is, a horizontal line.
So why care about scalars at all? DDD allows you to combine
multiple values into one plot. The basic idea is: if you want to plot
something that is neither an array nor a scalar, DDD takes
all numerical sub-values it can find and plots them all together in one
window. For instance, you can plot all local variables by selecting
Data => Display Local Variables, followed by Plot.
This will create a plot containing all numerical values as found in
the current local variables. Likewise, you can plot all numeric
members contained in a structure by selecting it, followed by
Plot.
If you want more control about what to include in a plot and what not, you can use display clusters (see Clustering). A common scenario is to plot a one-dimensional array together with the current index position. This is done in three steps:
Display.
Undisp =>
Cluster ().
Plot.
Scalars that are displayed together with arrays can be displayed either
as vertical lines or horizontal lines. By default, scalars are plotted
as horizontal lines. However, if a scalar is a valid index for an array
that was previously plotted, it is shown as a vertical line. You can
change this initial orientation by selecting the scalar display, followed
by Rotate.
At each program stop, DDD records the values of all displayed
variables, such that you can "undo" program execution (see Undoing Program Execution). These display histories can be plotted,
too. The menu item Plot => Plot history of () creates a
plot that shows all previously recorded values of the selected display.
If you want to print the plot, select File => Print Plot.
This pops up the DDD printing dialog, set up for printing plots.
Just as when printing graphs, you have the choice between printing to a
printer or a file and setting up appropriate options.
The actual printing is also performed by Gnuplot, using the appropriate driver. Please note the following caveats related to printing:
FIG files requires an appropriate driver built into
Gnuplot. Your Gnuplot program may not contain such a driver. In this
case, you will have to recompile Gnuplot, including the line
#define FIG in the Gnuplot term.h file.
Portrait option generates an EPS file useful for
inclusion in other documents. The Landscape option makes
DDD print the plot in the size specified in the Paper
Size option; this is useful for printing on a printer. In
Portrait mode, the Paper Size option is ignored.
Selected Only option is set by default, such that only the
currently selected plot is printed. (If you select multiple plots to be
printed, the respective outputs will all be concatenated, which may not
be what you desire.)
Via File => Command, you can enter Gnuplot commands
directly. Each command entered at the gnuplot> prompt is passed
to Gnuplot, followed by a Gnuplot replot command to update the
view. This is useful for advanced Gnuplot tasks.
Here's a simple example. The Gnuplot command
set xrange [xmin:xmax]
sets the horizontal range that will be displayed to xmin...xmax. To plot only the elements 10 to 20, enter:
gnuplot> set xrange [10:20]
After each command entered, DDD adds a replot command, such
that the plot is updated automatically.
Here's a more complex example. The following sequence of Gnuplot commands saves the plot in TeX format:
gnuplot> set output "plot.tex" # Set the output filename gnuplot> set term latex # Set the output format gnuplot> set term x11 # Show original picture again
Due to the implicit replot command, the output is automatically
written to plot.tex after the set term latex command.
The dialog keeps track of the commands entered; use the arrow keys to restore previous commands. Gnuplot error messages (if any) are also shown in the history area.
The interaction between DDD and Gnuplot is logged in the file
~/.ddd/log (see Logging). The DDD
--trace option logs this interaction on standard output.
If you want some external program to process the plot data (a
stand-alone Gnuplot program or the xmgr program, for instance),
you can save the plot data in a file, using File => Save
Data As. This pops up a dialog that lets you choose a data file to
save the plotted data in.
The generated file starts with a few comment lines. The actual data follows in X/Y or X/Y/Z format. It is the same file as processed by Gnuplot.
If you want to see how your data evolves in time, you can set a
breakpoint whose command sequence ends in a cont command
(see Breakpoint Commands. Each time this "continue" breakpoint is
reached, the program stops and DDD updates the displayed values,
including the plots. Then, DDD executes the breakpoint command
sequence, resuming execution.
This way, you can set a "continue" breakpoint at some decisive point
within an array-processing algorithm and have DDD display the
progress graphically. When your program has stopped for good, you can
use Undo and Redo to redisplay and examine previous
program states. See Undoing Program Execution, for details.
You can customize the Gnuplot program to invoke, as well as a number of basic settings.
Using Edit => Preferences => Helpers =>
Plot, you can choose the Gnuplot program to invoke. This is tied to
the following resource:
| plotCommand (class PlotCommand) | Resource |
The name of a Gnuplot executable. Default is gnuplot,
followed by some options to set up colors and the initial geometry.
|
Using Edit => Preferences => Helpers => Plot
Window, you can choose whether to use the Gnuplot plot window
(External) or to use the plot window supplied by DDD
(builtin). This is tied to the following resource:
| plotTermType (class PlotTermType) | Resource |
The Gnuplot terminal type. Can have one of two values:
|
You can further control interaction with the external plot window:
| plotWindowClass (class PlotWindowClass) | Resource |
The class of the Gnuplot output window. When invoking Gnuplot,
DDD waits for a window with this class and incorporates it into
its own user interface (unless plotTermType is xlib; see
above). Default is Gnuplot.
|
| plotWindowDelay (class WindowDelay) | Resource |
The time (in ms) to wait for the creation of the Gnuplot window. Before
this delay, DDD looks at each newly created window to see
whether this is the plot window to swallow. This is cheap, but
unfortunately, some window managers do not pass the creation event to
DDD. If this delay has passed, and DDD has not found
the plot window, DDD searches all existing windows, which
is pretty expensive. Default time is 2000.
|
To change Gnuplot settings, use these resources:
| plotInitCommands (class PlotInitCommands) | Resource |
The initial Gnuplot commands issued by DDD. Default is:
set parametric set urange [0:1] set vrange [0:1] set trange [0:1] The |
See the Gnuplot documentation for additional commands.
| plot2dSettings (class PlotSettings) | Resource |
Additional initial settings for 2-D plots. Default is set
noborder. Feel free to customize these settings as desired.
|
| plot3dSettings (class PlotSettings) | Resource |
Additional initial settings for 3-D plots. Default is set
border. Feel free to customize these settings as desired.
|
Using GDB or DBX, you can examine memory in any of several
formats, independently of your program's data types. The item
Data => Memory pops up a panel where you can choose the
format to be shown.
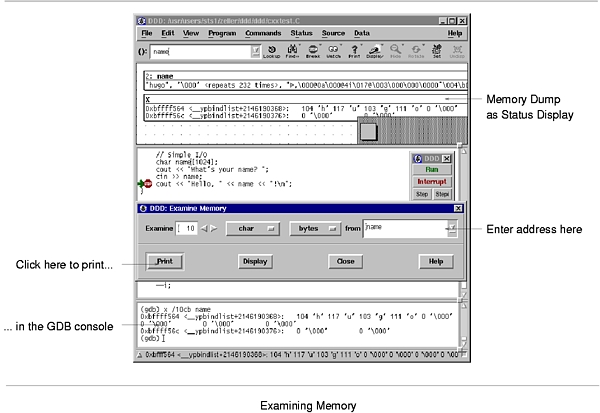
In the panel, you can enter
octal
hex
decimal
unsigned
binary
float
address
instruction
char
string
bytes
halfwords
words
giants
There are two ways to examine the values:
Print).
If you repeat the resulting x command by pressing <Return> in
the debugger console (see Command History), the following area of
memory is shown.
Display). If you choose to display the values, the values will
be updated automatically each time the program stop.
Sometimes, it is desirable to examine a program not only at the source level, but also at the machine level. DDD provides special machine code and register windows for this task.
To enable machine-level support, select Source => Display
Machine Code. With machine code enabled, an additional machine
code window shows up, displaying the machine code of the current
function.31
By moving the sash at the right of the separating line between source
and machine code, you can resize the source and machine code windows.
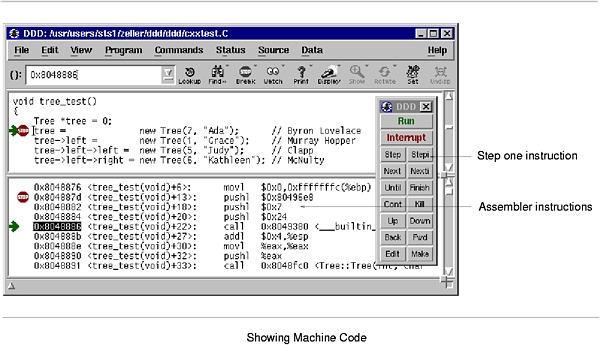
The machine code window works very much like the source window. You can
set, clear, and change breakpoints by selecting the address and pressing
a Break or Clear button; the usual popup menus are also
available. Breakpoints and the current execution position are displayed
simultaneously in both source and machine code.
The Lookup button can be used to look up the machine code for a
specific function--or the function for a specific address. Just click
on the location in one window and press Lookup to see the
corresponding code in the other window.
If source code is not available, only the machine code window is updated.
You can customize various aspects of the disassembling window. See Customizing Machine Code, for details.
All execution facilities available in the source code window are available in the machine code window as well. Two special facilities are convenient for machine-level debugging:
To execute just one machine instruction, click on the Stepi
button or select Program => Step Instruction.
To continue to the next instruction in the current function, click on
the Nexti button select Program => Next
Instruction.. This is similar to Stepi, but any subroutine
calls are executed without stopping.
Using GDB, it is often useful to do
graph display /i $pc
when stepping by machine instructions. This makes DDD automatically display the next instruction to be executed, each time your program stops.
DDD provides a register window showing the machine
register values after each program stop. To enable the register window,
select Status => Registers.32
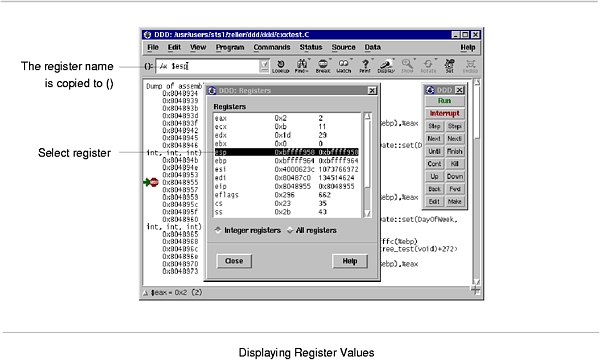
By selecting one of the registers, its name is copied to the argument
field. You can use it as value for Display, for instance, to
have its value displayed in the data window.
Enabling machine code via Source => Display Machine Code
(see Machine Code) toggles the following resource:
| disassemble (class Disassemble) | Resource |
If this is on, the source code is automatically disassembled.
The default is off. See Options, for the --disassemble
and --no-disassemble options.
|
You can keep disassembled code in memory, using Edit =>
Preferences => Source => Cache Machine Code:
| cacheMachineCode (class CacheMachineCode) | Resource |
Whether to cache disassembled machine code (on, default) or
not (off). Caching machine code requires more memory, but
makes DDD run faster.
|
You can control the indentation of machine code, using Edit
=> Preferences => Source => Machine Code
Indentation:
| indentCode (class Indent) | Resource |
The number of columns to indent the machine code, such that there is
enough place to display breakpoint locations. Default: 4.
|
The maxDisassemble resource controls how much is to be
disassembled. If maxDisassemble is set to 256 (default) and the
current function is larger than 256 bytes, DDD only disassembles
the first 256 bytes below the current location. You can set the
maxDisassemble resource to a larger value if you prefer to have a
larger machine code view.
| maxDisassemble (class MaxDisassemble) | Resource |
Maximum number of bytes to disassemble (default: 256). If this
is zero, the entire current function is disassembled.
|
DDD offers some basic facilities to edit and recompile the source code, as well as patching executables and core files.
make from within DDD.
In DDD itself, you cannot change the source file currently
displayed. Instead, DDD allows you to invoke a text
editor. To invoke a text editor for the current source file, select
the Edit button or Source => Edit Source.
By default, DDD tries a number of common editors. You can customize DDD to use your favorite editor; See Customizing Editing, for details.
After the editor has exited, the source code shown is automatically updated.
If you have DDD and an editor running in parallel, you can also
update the source code manually via Source => Reload
Source. This reloads the source code shown from the source file.
Since DDD automatically reloads the source code if the debugged
program has been recompiled, this should seldom be necessary.
You can customize the editor to be used via Edit =>
Preferences => Helpers => Edit Sources. This is tied to
the following resource:
| editCommand (class EditCommand) | Resource |
A command string to invoke an editor on the specific file.
@LINE@ is replaced by the current line number, @FILE@
by the file name. The default is to invoke $XEDITOR first, then
$EDITOR, then vi:
Ddd*editCommand: \
${XEDITOR-false} +@LINE@ @FILE@ || \
xterm -e ${EDITOR-vi} +@LINE@ @FILE@
|
This ~/.ddd/init setting invokes an editing session
for an XEmacs editor running gnuserv:
Ddd*editCommand: gnuclient +@LINE@ @FILE@
This ~/.ddd/init setting invokes an editing session for an
Emacs editor running emacsserver:
Ddd*editCommand: emacsclient +@LINE@ @FILE@
This resource is experimental:
| sourceEditing (class SourceEditing) | Resource |
If this is on, the displayed source code becomes editable.
This is an experimental feature and may become obsolete in future
DDD releases. Default is off.
|
To recompile the source code using make, you can select
File => Make. This pops up a dialog where you can enter a
Make Target--typically the name of the executable. Clicking on
the Make button invokes the make program with the given
target.
The Make button on the command tool re-invokes make
with the most recently given arguments.
Using GDB, you can open your program's executable code (and the core file) for both reading and writing. This allows alterations to machine code, such that you can intentionally patch your program's binary. For example, you might want to turn on internal debugging flags, or even to make emergency repairs.
To patch the binary, enable Edit => GDB Settings =>
Writing into executable and core files. This makes GDB open executable
and core files for both reading and writing. If you have already loaded
a file, you must load it again (using Edit => Open File or
Edit => Open Core), for your new setting to take effect.
Be sure to turn off Writing into executable and core files as
soon as possible, to prevent accidental alterations to machine code.
All the buttons you click within DDD get eventually translated into some debugger command, shown in the debugger console. You can also type in and edit these commands directly.
In the debugger console, you can interact with the command
interface of the inferior debugger. Enter commands at the
debugger prompt--that is, (gdb) for GDB, (dbx) for
DBX, (ladebug) for Ladebug, > for XDB, > and
thread[depth] for JDB, or (Pydb) for PYDB, or
DB<> for Perl. You can use arbitrary debugger commands; use the
<Return> key to enter them.
When using GDB or Perl, you can use the <TAB> key for completing commands and arguments. This works in the debugger console as well as in all other text windows.
GDB can fill in the rest of a word in a command for you, if there is only one possibility; it can also show you what the valid possibilities are for the next word in a command, at any time. This works for GDB commands, GDB subcommands, and the names of symbols in your program.
Press the <TAB> key whenever you want GDB to fill out the rest of a word. If there is only one possibility, GDB fills in the word, and waits for you to finish the command (or press <RET> to enter it). For example, if you type
(gdb) info bre <TAB>
GDB fills in the rest of the word breakpoints, since that is
the only info subcommand beginning with bre:
(gdb) info breakpoints
You can either press <RET> at this point, to run the info
breakpoints command, or backspace and enter something else, if
breakpoints does not look like the command you expected. (If you
were sure you wanted info breakpoints in the first place, you
might as well just type <RET> immediately after info bre, to
exploit command abbreviations rather than command completion).
If there is more than one possibility for the next word when you press
<TAB>, DDD sounds a bell. You can either supply more
characters and try again, or just press <TAB> a second time; GDB
displays all the possible completions for that word. For example, you
might want to set a breakpoint on a subroutine whose name begins with
make_, but when you type b make_<TAB>, DDD just
sounds the bell. Typing <TAB> again displays all the function names
in your program that begin with those characters. If you type <TAB>
again, you cycle through the list of completions, for example:
(gdb) b make_ <TAB>
DDD sounds bell; press <TAB> again, to see:
make_a_section_from_file make_environ make_abs_section make_function_type make_blockvector make_pointer_type make_cleanup make_reference_type make_command make_symbol_completion_list (gdb) b make_ <TAB>
DDD presents one expansion after the other:
(gdb) b make_a_section_from_file <TAB> (gdb) b make_abs_section <TAB> (gdb) b make_blockvector <TAB>
After displaying the available possibilities, GDB copies your partial
input (b make_ in the example) so you can finish the command--by
pressing <TAB> again, or by entering the remainder manually.
Sometimes the string you need, while logically a "word", may contain
parentheses or other characters that GDB normally excludes from its
notion of a word. To permit word completion to work in this situation,
you may enclose words in ' (single quote marks) in GDB commands.
The most likely situation where you might need this is in typing the
name of a C++ function. This is because C++ allows function overloading
(multiple definitions of the same function, distinguished by argument
type). For example, when you want to set a breakpoint you may need to
distinguish whether you mean the version of name that takes an
int parameter, name(int), or the version that takes a
float parameter, name(float). To use the word-completion
facilities in this situation, type a single quote ' at the
beginning of the function name. This alerts GDB that it may need to
consider more information than usual when you press <TAB> to request
word completion:
(gdb) b 'bubble( <TAB> bubble(double,double) bubble(int,int) (gdb) b 'bubble(
In some cases, DDD can tell that completing a name requires using quotes. When this happens, DDD inserts the quote for you (while completing as much as it can) if you do not type the quote in the first place:
(gdb) b bub <TAB>
DDD alters your input line to the following, and rings a bell:
(gdb) b 'bubble(
In general, DDD can tell that a quote is needed (and inserts it) if you have not yet started typing the argument list when you ask for completion on an overloaded symbol.
If you prefer to use the <TAB> key for switching between items,
unset Edit => Preferences => General => TAB
Key completes in All Windows. This is useful if you have
pointer-driven keyboard focus (see below) and no special usage for the
<TAB> key. If the option is set, the <TAB> key completes in the
debugger console only.
This option is tied to the following resource:
| globalTabCompletion (class GlobalTabCompletion) | Resource |
If this is on (default), the <TAB> key completes arguments in
all windows. If this is off, the <TAB> key completes
arguments in the debugger console only.
|
You can repeat previous and next commands by pressing the <Up> and <Down> arrow keys, respectively. This presents you previous and later commands on the command line; use <Return> to apply the current command.
If you enter an empty line (just use <Return> at the debugger prompt), the last command is repeated as well.
Commands => Command History shows the command history.
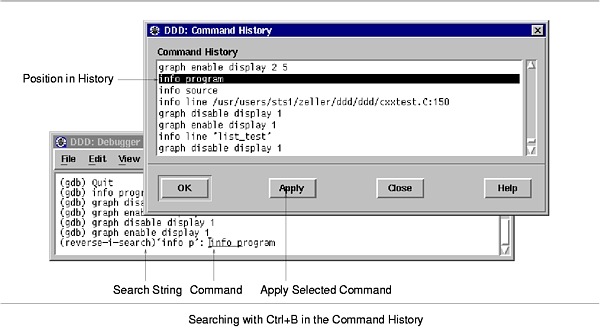
You can search for previous commands by pressing <Ctrl+B>. This invokes incremental search mode, where you can enter a string to be searched in previous commands. Press <Ctrl+B> again to repeat the search, or <Ctrl+F> to search in the reverse direction. To return to normal mode, press <ESC>, or use any cursor command.
The command history is automatically saved when exiting DDD.
You can turn off this feature by setting the following resource to
off:
| saveHistoryOnExit (class SaveHistoryOnExit) | Resource |
If on (default), the command history is automatically saved
when DDD exits.
|
Rather than entering commands at the debugger console, you may prefer to enter commands at the terminal window DDD was invoked from.
When DDD is invoked using the --tty option, it enables its
TTY interface, taking additional debugger commands from
standard input and forwarding debugger output to standard output, just
as if the inferior debugger had been invoked directly. All remaining
DDD functionality stays unchanged.
By default, the debugger console remains closed if DDD is
invoked using the --tty option. Use View =>
Debugger Console to open it.
DDD can be configured to use the readline library for reading
in commands from standard input. This GNU library provides
consistent behavior for programs which provide a command line interface
to the user. Advantages are GNU Emacs-style or vi-style inline
editing of commands, csh-like history substitution, and a
storage and recall of command history across debugging sessions.
See Command Line Editing, for details on command-line editing via the
TTY interface.
You can run DDD as an inferior debugger in other debugger front-ends, combining their special abilities with those of DDD.
To have DDD run as an inferior debugger in other front-ends, the
general idea is to set up your debugger front-end such that
ddd --tty is invoked instead of the inferior debugger.
When DDD is invoked using the --tty option, it enables its
TTY interface, taking additional debugger commands from
standard input and forwarding debugger output to standard output, just
as if the inferior debugger had been invoked directly. All remaining
DDD functionality stays unchanged.
In case your debugger front-end uses the GDB -fullname
option to have GDB report source code positions, the --tty
option is not required. DDD recognizes the -fullname
option, finds that it has been invoked from a debugger front-end and
automatically enables the TTY interface.
If DDD is invoked with the -fullname option, the debugger
console and the source window are initially disabled, as their
facilities are supposed to be provided by the integrating front-end. In
case of need, you can use the View menu to re-enable these
windows.
To integrate DDD with Emacs, use M-x gdb or M-x dbx
in Emacs to start a debugging session. At the prompt, enter
ddd --tty (followed by --dbx or
--gdb, if required), and the name of the program to be
debugged. Proceed as usual.
To integrate DDD with XEmacs, set the variable
gdb-command-name to "ddd", by inserting the following line
in your ~/.emacs file:
(setq gdb-command-name "ddd")
You can also evaluate this expression by pressing <ESC> <:> and entering it directly (<ESC> <ESC> for XEmacs 19.13 and earlier).
To start a DDD debugging session in XEmacs, use M-x gdb or
M-x gdbsrc. Proceed as usual.
To integrate DDD with XXGDB, invoke xxgdb as
xxgdb -db_name ddd -db_prompt '(gdb) '
To facilitate interaction, you can add own command buttons to
DDD. These buttons can be added below the debugger console
(Console Buttons), the source window (Source Buttons), or
the data window (Data Buttons).
To define individual buttons, use the Button Editor, invoked via
Commands => Edit Buttons. The button editor displays a
text, where each line contains the command for exactly one button.
Clicking on OK creates the appropriate buttons from the text. If
the text is empty (the default), no button is created.
As a simple example, assume you want to create a print i
button. Invoke Commands => Edit Buttons and enter a line
saying print i in the button editor. Then click on
OK. A button named Print i will now appear below the
debugger console--try it! To remove the button, reopen the button
editor, clear the print i line and press OK again.
If a button command contains (), the string () will
automatically be replaced by the contents of the argument field. For
instance, a button named return () will execute the GDB
return command with the current content of the argument field as
argument.
By default, DDD disables buttons whose commands are not
supported by the inferior debugger. To enable such buttons, unset the
Enable supported buttons only toggle in the button editor.
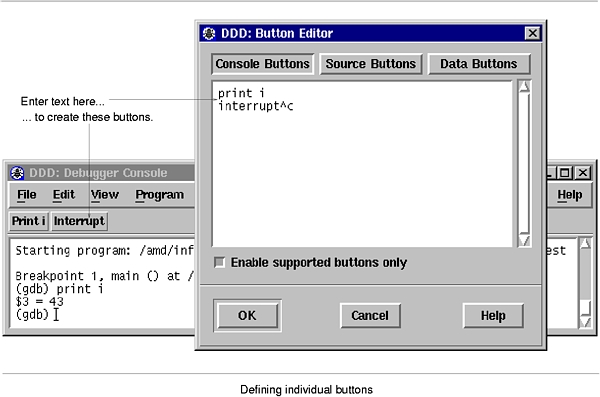
DDD also allows you to specify control sequences and special labels for user-defined buttons. See Customizing Buttons, for details.
DDD allows defining additional command buttons; See Defining Buttons, for doing this interactively. This section describes the resources that control user-defined buttons.
| consoleButtons (class Buttons) | Resource |
|
A newline-separated list of buttons to be added under the debugger
console. Each button issues the command given by its name.
The following characters have special meanings:
The following button names are reserved:
The default resource value is empty--no console buttons are created. Here are some examples to insert into your Ddd*consoleButtons: Yes\nNo\nbreak^C This setting creates some more buttons: Ddd*consoleButtons: \ Yes\nNo\nrun\nClear\nPrev\nNext\nApply\nbreak^C See also the |
| dataButtons (class Buttons) | Resource |
A newline-separated list of buttons to be added under the data display.
Each button issues the command given by its name. See the
consoleButtons resource, above, for details on button syntax.
The default resource value is empty--no source buttons are created. |
| sourceButtons (class Buttons) | Resource |
A newline-separated list of buttons to be added under the debugger
console. Each button issues the command given by its name. See the
consoleButtons resource, above, for details on button syntax.
The default resource value is empty--no source buttons are created. Here are some example to insert into your Ddd*sourceButtons: \ run\nstep\nnext\nstepi\nnexti\ncont\n\ finish\nkill\nup\ndown\n\ Back\nForward\nEdit\ninterrupt^C This setting creates some buttons which are not found on the command tool: Ddd*sourceButtons: \ print *()\ngraph display *()\nprint /x ()\n\ whatis ()\nptype ()\nwatch ()\nuntil\nshell An even more professional setting uses customized button labels. Ddd*sourceButtons: \ print *(()) // Print *()\n\ graph display *(()) // Display *()\n\ print /x ()\n\ whatis () // What is ()\n\ ptype ()\n\ watch ()\n\ until\n\ shell See also the |
| toolButtons (class Buttons) | Resource |
|
A newline-separated list of buttons to be included in the command tool
or the command tool bar (see Disabling the Command Tool). Each
button issues the command given by its name. See Defining Buttons,
for details on button syntax.
The default resource value is Ddd*toolButtons: \ run\nbreak^C\nstep\nstepi\nnext\nnexti\n\ until\nfinish\ncont\n\kill\n\ up\ndown\nBack\nForward\nEdit\nMake For each button, its location in the command tool must be specified
using If the |
The following resources set up button details:
| labelDelimiter (class LabelDelimiter) | Resource |
The string used to separate labels from commands and shortcuts.
Default is //.
|
| verifyButtons (class VerifyButtons) | Resource |
If on (default), verify for each button whether its command is
actually supported by the inferior debugger. If the command is unknown,
the button is disabled. If this resource is off, no checking is
done: all commands are accepted "as is".
|
Aside from breakpoint commands (see Breakpoint Commands), DDD also allows you to define user-defined commands. A user-defined command is a sequence of commands to which you assign a new name as a command. This new command can be entered at the debugger prompt or invoked via a button.
Aside from breakpoint commands (see Breakpoint commands,
above), DDD also allows you to store sequences of commands
as a user-defined GDB command. A user-defined command
is a sequence of GDB commands to which you assign a new name
as a command. Using DDD, this is done via the Command
Editor, invoked via Commands => Define Command.
A GDB command is created in five steps:
Command field. Use the
drop-down list on the right to select from already defined commands.
Record to begin the recording of the command sequence.
End or enter end at
the GDB prompt. To cancel the recording, click on
Interrupt or press <ESC>.
Edit >> to edit the recorded commands.
When done with editing, click on Edit << to close the
commands editor.
After the command is defined, you can enter it at the GDB prompt. You
may also click on Apply to apply the given user-defined command.
For convenience, you can assign a button to the defined command.
Enabling one of the Button locations will add a button with the
given command to the specified location. If you want to edit the
button, select Commands => Edit Buttons. See Defining Buttons, for a discussion.
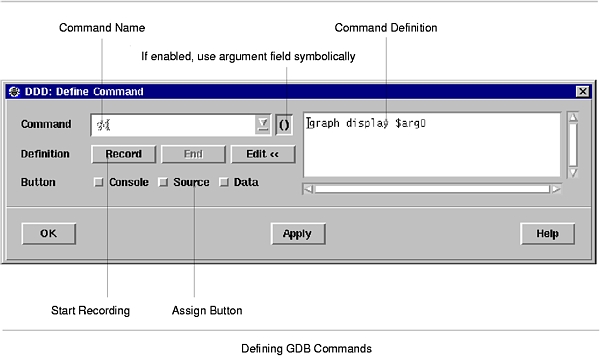
When user-defined GDB commands are executed, the commands of the definition are not printed. An error in any command stops execution of the user-defined command.33
If used interactively, commands that would ask for confirmation proceed without asking when used inside a user-defined command. Many GDB commands that normally print messages to say what they are doing omit the messages when used in a user-defined command.
To save all command definitions, use Edit => Save Options.
If you want to pass arguments to user-defined commands, you can enable
the () toggle button in the Command Editor. Enabling
() has two effects:
$arg0, which is how GDB denotes the argument of a
user-defined command. When GDB executes the command, it will replace
$arg0 by the current command argument.
While defining a command, you can toggle the () button as you
wish to switch between using the argument field symbolically and
literally.
As an example, let us define a command contuntil that will set a
breakpoint in the given argument and continue execution.
contuntil in the Command field.
() toggle button.
Record to start recording. Note that the
contents of the argument field change to $arg0.
Break at () to create a breakpoint. Note that the
recorded breakpoint command refers to $arg0.
Cont to continue execution.
End to end recording. Note that the argument field
is restored to its original value.
Button locations. This creates a
Contuntil () button where () will be replaced by the
current contents of the argument field--and thus passed to the
contuntil command.
Contuntil () button or enter a
contuntil command at the GDB prompt. (If you plan to
use the command frequently, you may wish to define a cu
command, which again calls contuntil with its argument. This
is a nice exercise.)
There is a little drawback with argument commands: a user-defined command in GDB has no means to access the argument list as a whole; only the first argument (up to whitespace) is processed. This may change in future GDB releases.
If your inferior debugger allows you to define own command sequences, you can also use these user-defined commands within DDD; just enter them at the debugger prompt.
However, you may encounter some problems:
bp sets a
breakpoint, DDD may not display it immediately, because
DDD does not know that bp changes the breakpoint state.
graph commands within user-defined
commands. This is only natural, because user-defined commands are
interpreted by the inferior debugger, which does not know about
DDD commands.
As a solution, DDD provides a simple facility called
auto-commands. If DDD receives any output from the
inferior debugger in the form prefix command, it will
interpret command as if it had been entered at the debugger
prompt. prefix is a user-defined string, for example
ddd: .
Suppose you want to define a command gd that serves as
abbreviation for graph display. All the command gd has
to do is to issue a string
ddd: graph display argument
where argument is the argument given to gd. Using
GDB, this can be achieved using the echo command. In
your ~/.gdbinit file, insert the lines
define gd echo ddd: graph display $arg0\n end
To complete the setting, you must also set the autoCommandPrefix
resource to the ddd: prefix you gave in your command.
In ~/.ddd/init, write:
Ddd*autoCommandPrefix: ddd:\
(Be sure to leave a space after the trailing backslash.)
Entering gd foo will now have the same effect as entering
graph display foo at the debugger prompt.
Please note: In your commands, you should choose some other prefix than
ddd: . This is because auto-commands raise a security
problem, since arbitrary commands can be executed. Just imagine some
malicious program issuing a string like prefix shell rm -fr
~ when being debugged! As a consequence, be sure to choose your own
prefix; it must be at least three characters long.
Like any good X citizen, DDD comes with a large
application-defaults file named Ddd. This appendix documents the
actions and images referenced in Ddd, such that you can easily
modify them.
The following DDD actions may be used in translation tables.
| ddd-get-focus () | Action |
| Assign focus to the element that just received input. |
| ddd-next-tab-group () | Action |
| Assign focus to the next tab group. |
| ddd-prev-tab-group () | Action |
| Assign focus to the previous tab group. |
| ddd-previous-tab-group () | Action |
| Assign focus to the previous tab group. |
These actions are used in the DDD graph editor.
| end () | Action |
End the action initiated by select. Bound to a button up event.
|
| extend () | Action |
| Extend the current selection. Bound to a button down event. |
| extend-or-move () | Action |
| Extend the current selection. Bound to a button down event. If the pointer is dragged, move the selection. |
| follow () | Action |
Continue the action initiated by select. Bound to a pointer
motion event.
|
| graph-select () | Action |
Equivalent to select, but also updates the current argument.
|
| graph-select-or-move () | Action |
Equivalent to select-or-move, but also updates the current argument.
|
| graph-extend () | Action |
Equivalent to extend, but also updates the current argument.
|
| graph-extend-or-move () | Action |
Equivalent to extend-or-move, but also updates the current argument.
|
| graph-toggle () | Action |
Equivalent to toggle, but also updates the current argument.
|
| graph-toggle-or-move () | Action |
Equivalent to toggle-or-move, but also updates the current argument.
|
graph-popup-menu ([graph|node|shortcut])
|
Action |
Pops up a menu. graph pops up a menu with global graph
operations, node pops up a menu with node operations, and
shortcut pops up a menu with display shortcuts.
If no argument is given, pops up a menu depending on the context: when
pointing on a node with the <Shift> key pressed, behaves like
|
| graph-dereference () | Action |
| Dereference the selected display. |
| graph-detail () | Action |
| Show or hide detail of the selected display. |
| graph-rotate () | Action |
| Rotate the selected display. |
| graph-dependent () | Action |
| Pop up a dialog to create a dependent display. |
hide-edges ([any|both|from|to])
|
Action |
Hide some edges. any means to process all edges where either
source or target node are selected. both means to process all
edges where both nodes are selected. from means to process all
edges where at least the source node is selected. to means to
process all edges where at least the target node is selected. Default
is any.
|
layout ([regular|compact], [[+|-] degrees])
|
Action |
Layout the graph. regular means to use the regular layout
algorithm; compact uses an alternate layout algorithm, where
successors are placed next to their parents. Default is
regular. degrees indicates in which direction the graph
should be layouted. Default is the current graph direction.
|
| move-selected (x-offset, y-offset) | Action |
Move all selected nodes in the direction given by x-offset and
y-offset. x-offset and y-offset is either given as a
numeric pixel value, or as +grid, or -grid, meaning the
current grid size.
|
| normalize () | Action |
| Place all nodes on their positions and redraw the graph. |
rotate ([[+|-]degrees])
|
Action |
Rotate the graph around degrees degrees.
degrees must be a multiple of 90. Default is +90.
|
| select () | Action |
| Select the node pointed at. Clear all other selections. Bound to a button down event. |
| select-all () | Action |
| Select all nodes in the graph. |
| select-first () | Action |
| Select the first node in the graph. |
| select-next () | Action |
| Select the next node in the graph. |
| select-or-move () | Action |
| Select the node pointed at. Clear all other selections. Bound to a button down event. If the pointer is dragged, move the selected node. |
| select-prev () | Action |
| Select the previous node in the graph. |
show-edges ([any|both|from|to])
|
Action |
Show some edges. any means to process all edges where either
source or target node are selected. both means to process all
edges where both nodes are selected. from means to process all
edges where at least the source node is selected. to means to
process all edges where at least the target node is selected. Default
is any.
|
| snap-to-grid () | Action |
| Place all nodes on the nearest grid position. |
| toggle () | Action |
| Toggle the current selection--if the node pointed at is selected, it will be unselected, and vice versa. Bound to a button down event. |
| toggle-or-move () | Action |
| Toggle the current selection--if the node pointed at is selected, it will be unselected, and vice versa. Bound to a button down event. If the pointer is dragged, move the selection. |
| unselect-all () | Action |
| Clear the selection. |
These actions are used in the debugger console and other text fields.
| gdb-backward-character () | Action |
Move one character to the left. Bound to Left.
|
| gdb-beginning-of-line () | Action |
Move cursor to the beginning of the current line, after the prompt.
Bound to HOME.
|
| gdb-control (control-character) | Action |
Send the given control-character to the inferior debugger.
control-character must be specified in the form ^X,
where X is an upper-case letter, or ?.
|
| gdb-command (command) | Action |
Execute command in the debugger console. The following
replacements are performed on command:
|
| gdb-complete-arg (command) | Action |
| Complete current argument as if command was prepended. Bound to <Ctrl+T>. |
| gdb-complete-command () | Action |
| Complete current command line in the debugger console. Bound to <TAB>. |
| gdb-complete-tab (command) | Action |
| If global <TAB> completion is enabled, complete current argument as if command was prepended. Otherwise, proceed as if the <TAB> key was hit. Bound to <TAB>. |
| gdb-delete-or-control (control-character) | Action |
Like gdb-control, but effective only if the cursor is at the end
of a line. Otherwise, control-character is ignored and the
character following the cursor is deleted. Bound to <Ctrl+D>.
|
| gdb-end-of-line () | Action |
Move cursor to the end of the current line. Bound to End.
|
| gdb-forward-character () | Action |
Move one character to the right. Bound to Right.
|
| gdb-insert-graph-arg () | Action |
Insert the contents of the data display argument field ().
|
| gdb-insert-source-arg () | Action |
Insert the contents of the source argument field ().
|
| gdb-interrupt () | Action |
If DDD is in incremental search mode, exit it; otherwise
call gdb-control(^C).
|
| gdb-isearch-prev () | Action |
| Enter reverse incremental search mode. Bound to <Ctrl+B>. |
| gdb-isearch-next () | Action |
| Enter incremental search mode. Bound to <Ctrl+F>. |
| gdb-isearch-exit () | Action |
| Exit incremental search mode. Bound to <ESC>. |
| gdb-next-history () | Action |
Recall next command from history. Bound to Down.
|
| gdb-prev-history () | Action |
Recall previous command from history. Bound to Up.
|
| gdb-previous-history () | Action |
Recall previous command from history. Bound to Up.
|
| gdb-process ([action [, args...]]) | Action |
Process the given event in the debugger console. Bound to key events
in the source and data window. If this action is bound to the source
window, and the source window is editable, perform
action(args...) on the source window instead; if
action is not given, perform self-insert().
|
| gdb-select-all () | Action |
If the selectAllBindings resource is set to Motif,
perform beginning-of-line. Otherwise, perform select-all.
Bound to <Ctrl+A>.
|
| gdb-set-line (value) | Action |
| Set the current line to value. Bound to <Ctrl+U>. |
These actions are used in the source and code windows.
| source-delete-glyph () | Action |
| Delete the breakpoint related to the glyph at cursor position. |
| source-double-click ([text-action [, line-action [, function-action]]]) | Action |
The double-click action in the source window.
|
| source-drag-glyph () | Action |
| Initiate a drag on the glyph at cursor position. |
| source-drop-glyph ([action]) | Action |
Drop the dragged glyph at cursor position. action is either
move, meaning to move the dragged glyph, or copy,
meaning to copy the dragged glyph. If no action is given,
move is assumed.
|
| source-end-select-word () | Action |
| End selecting a word. |
| source-follow-glyph () | Action |
| Continue a drag on the glyph at cursor position. Usually bound to some motion event. |
| source-popup-menu () | Action |
| Pop up a menu, depending on the location. |
| source-set-arg () | Action |
| Set the argument field to the current selection. Typically bound to some selection operation. |
| source-start-select-word () | Action |
| Start selecting a word. |
| source-update-glyphs () | Action |
| Update all visible glyphs. Usually invoked after a scrolling operation. |
DDD installs a number of images that may be used as pixmap resources, simply by giving a symbolic name. For button images, three variants are installed as well:
-hi indicates a highlighted variant (Button is entered).
-arm indicates an armed variant (Button is pushed).
-xx indicates a disabled (insensitive) variant.
| break_at | Image |
Break at () button.
|
| clear_at | Image |
Clear at () button.
|
| ddd | Image |
| DDD icon. |
| delete | Image |
Delete () button.
|
| disable | Image |
Disable button.
|
| dispref | Image |
Display * () button.
|
| display | Image |
Display () button.
|
| drag_arrow | Image |
| The execution pointer (being dragged). |
| drag_cond | Image |
| A conditional breakpoint (being dragged). |
| drag_stop | Image |
| A breakpoint (being dragged). |
| drag_temp | Image |
| A temporary breakpoint (being dragged). |
| enable | Image |
Enable button.
|
| find_forward | Image |
Find>> () button.
|
| find_backward | Image |
Find<< () button.
|
| grey_arrow | Image |
| The execution pointer (not in lowest frame). |
| grey_cond | Image |
| A conditional breakpoint (disabled). |
| grey_stop | Image |
| A breakpoint (disabled). |
| grey_temp | Image |
| A temporary breakpoint (disabled). |
| hide | Image |
Hide () button.
|
| lookup | Image |
Lookup () button.
|
| maketemp | Image |
Make Temporary button.
|
| new_break | Image |
New Breakpoint button.
|
| new_display | Image |
New Display button.
|
| new_watch | Image |
New Watchpoint button.
|
| plain_arrow | Image |
| The execution pointer. |
| plain_cond | Image |
| A conditional breakpoint (enabled). |
| plain_stop | Image |
| A breakpoint (enabled). |
| plain_temp | Image |
| A temporary breakpoint (enabled). |
| Image |
Print () button.
|
| properties | Image |
Properties button.
|
| rotate | Image |
Rotate () button.
|
| set | Image |
Set () button.
|
| show | Image |
Show () button.
|
| signal_arrow | Image |
| The execution pointer (stopped by signal). |
| undisplay | Image |
Undisplay () button.
|
| unwatch | Image |
Unwatch () button.
|
| watch | Image |
Watch () button.
|
Sometimes you will encounter a bug in DDD. Although we cannot promise we can or will fix the bug, and we might not even agree that it is a bug, we want to hear about bugs you encounter in case we do want to fix them.
To make it possible for us to fix a bug, you must report it. In order to do so effectively, you must know when and how to do it.
Send bug reports for DDD via electronic mail to
bug-ddd@gnu.org
Before sending in a bug report, try to find out whether the problem cause really lies within DDD. A common cause of problems are incomplete or missing X or Motif installations, for instance, or bugs in the X server or Motif itself. Running DDD as
$ ddd --check-configuration
checks for common problems and gives hints on how to repair them.
Another potential cause of problems is the inferior debugger; occasionally, they show bugs, too. To find out whether a bug was caused by the inferior debugger, run DDD as
$ ddd --trace
This shows the interaction between DDD and the inferior debugger
on standard error while DDD is running. (If --trace is
not given, this interaction is logged in the file
~/.ddd/log; see Logging) Compare the debugger output
to the output of DDD and determine which one is wrong.
Here are some guidelines for bug reports:
To enable us to fix a DDD bug, you must include the following information:
$ ddd --configuration
to get the configuration information. If this does not work, please include at least the DDD version, the type of machine you are using, and its operating system name and version number.
gdb-4.17 or
dbx as shipped with Solaris 2.6).
gcc-2.8.1).
~/.ddd/log. Include all trace output from the
DDD invocation up to the first bug occurrence; insert own
comments where necessary.
Be sure to include this information in every single bug report.
If things go wrong, the first and most important information source is
the DDD log file. This file, created in
~/.ddd/log (~ stands for your home directory),
records the following information:
$ program
args...
# message.
-> text.
<- text.
<= text.34
>> text.
<< text.
<= text.
This information, all in one place, should give you (and anyone maintaining DDD) a first insight of what's going wrong.
The log files created by DDD can become quite large, so you
might want to turn off logging. There is no explicit DDD
feature that allows you to do that. However, you can easily create a
symbolic link from ~/.ddd/log to /dev/null,
such that logging information is lost. Enter the following commands at
the shell prompt:
$ cd $ rm .ddd/log $ ln -s /dev/null .ddd/log
Be aware, though, that having logging turned off makes diagnostics much more difficult; in case of trouble, it may be hard to reproduce the error.
As long as DDD is compiled with -g (see Compiling for Debugging), you can invoke a debugger on DDD--even DDD
itself, if you wish. From within DDD, a special
Maintenance menu is provided that invokes GDB on the running
DDD process. See Maintenance Menu, for details.
The DDD distribution comes with a .gdbinit file that is
suitable for debugging DDD. Among others, this defines a
ddd command that sets up an environment for debugging DDD
and a string command that lets you print the contents of
DDD string variables; just use print var
followed by string.
You can cause DDD to dump core at any time by sending it a
SIGUSR1 signal. DDD resumes execution while you can examine
the core file with GDB.
When debugging DDD, it can be useful to make DDD not
catch fatal errors. This can be achieved by setting the environment
variable DDD_NO_SIGNAL_HANDLERS before invoking
DDD.
You can use these additional resources to obtain diagnostics about DDD. Most of them are tied to a particular invocation option.
| appDefaultsVersion (class Version) | Resource |
| The version of the DDD app-defaults file. If this string does not match the version of the current DDD executable, DDD issues a warning. |
| checkConfiguration (class CheckConfiguration) | Resource |
If on, check the DDD environment (in particular, the
X configuration), report any possible problem causes and exit.
See Options, for the --check-configuration option.
|
| dddinitVersion (class Version) | Resource |
The version of the DDD executable that last wrote the
~/.ddd/init file. If this string does not match the
version of the current DDD executable, DDD issues
a warning.
|
| debugCoreDumps (class DebugCoreDumps) | Resource |
If on, DDD invokes a debugger on itself when receiving a
fatal signal. See Maintenance Menu, for setting this resource.
|
| dumpCore (class DumpCore) | Resource |
If on (default), DDD dumps core when receiving a
fatal signal. See Maintenance Menu, for setting this resource.
|
| maintenance (class Maintenance) | Resource |
If on, enables the top-level Maintenance menu
(see Maintenance Menu) with additional options. See Options, for
the --maintenance option.
|
| showConfiguration (class ShowConfiguration) | Resource |
If on, show the DDD configuration on standard output and
exit. See Options, for the --configuration option.
|
| showFonts (class ShowFonts) | Resource |
If on, show the DDD font definitions on standard output
and exit. See Options, for the --fonts option.
|
| showInvocation (class ShowInvocation) | Resource |
If on, show the DDD invocation options on standard
output and exit. See Options, for the --help option.
|
| showLicense (class ShowLicense) | Resource |
If on, show the DDD license on standard output and
exit. See Options, for the --license option.
|
| showManual (class ShowManual) | Resource |
If on, show this DDD manual page on standard output and exit.
If the standard output is a terminal, the manual page is shown in a
pager ($PAGER, less or more).
See Options, for the --manual option.
|
| showNews (class ShowNews) | Resource |
If on, show the DDD news on standard output and
exit. See Options, for the --news option.
|
| showVersion (class ShowVersion) | Resource |
If on, show the DDD version on standard output and
exit. See Options, for the --version option.
|
| suppressWarnings (class SuppressWarnings) | Resource |
If on, X warnings are suppressed. This is sometimes useful for
executables that were built on a machine with a different X or Motif
configuration. By default, this is off. See X Warnings, for
details.
|
| trace (class Trace) | Resource |
If on, show the dialog between DDD and the inferior debugger
on standard output. Default is off. See Options, for the
--trace option.
|
Some GDB settings are essential for DDD to work correctly. These settings with their correct values are:
set height 0 set width 0 set verbose off set prompt (gdb)
DDD sets these values automatically when invoking GDB; if these values are changed, there may be some malfunctions, especially in the data display.
When debugging at the machine level with GDB 4.12 and earlier as
inferior debugger, use a display /x $pc command to ensure the
program counter value is updated correctly at each stop. You may also
enter the command in ~/.gdbinit or (better yet) upgrade to the
most recent GDB version.
When used for debugging Pascal-like programs, DDD does not infer correct array subscripts and always starts to count with 1.
With some DBX versions (notably Solaris DBX), DDD strips C-style and C++-style comments from the DBX output in order to interpret it properly. This also affects the output of the debugged program when sent to the debugger console. Using the separate execution window avoids these problems.
In some DBX versions (notably DEC DBX and AIX DBX), there is no
automatic data display. As an alternative, DDD uses the DBX
print command to access data values. This means that variable
names are interpreted according to the current frame; variables outside
the current frame cannot be displayed.
All DBX limitations (see DBX) apply to Ladebug as well.
There is no automatic data display in XDB. As a workaround,
DDD uses the p command to access data values. This
means that variable names are interpreted according to the current
frame; variables outside the current frame cannot be displayed.
There is no automatic data display in JDB. As a workaround,
DDD uses the dump command to access data values.
This means that variable names are interpreted according to the
current frame; variables outside the current frame cannot be
displayed.
The JDB dump and print commands do not support
expression evaluation. Hence, you cannot display arbitrary
expressions.
Parsing of JDB output is quite CPU-intensive, due to the
recognition of asynchronous prompts (any thread may output anything at
any time, including prompts). Hence, a program producing much console
output is likely to slow down DDD considerably. In such a
case, have the program run with -debug in a separate window and
attach JDB to it using the -passwd option.
There is no automatic data display in Perl. As a workaround,
DDD uses the x command to access data values. This
means that variable names are interpreted according to the current
frame; variables outside the current frame cannot be displayed.
DDD includes a number of hacks that make DDD run with LessTif, a free Motif clone, without loss of functionality. Since a DDD binary may be dynamically bound and used with either an OSF/Motif or LessTif library, these lesstif hacks can be enabled and disabled at run time.
Whether the lesstif hacks are included at run-time depends on the
setting of the lessTifVersion resource:
| lessTifVersion (class LessTifVersion) | Resource |
Indicates the LessTif version DDD is running against. For
LessTif version x.y, the value is x multiplied by 1000 plus
y--for instance, the value 79 stands for LessTif 0.79 and
the value 1005 stands for LessTif 1.5.
If the value of this resource is less than 1000, indicating LessTif 0.99 or earlier, DDD enables version-specific hacks to make DDD work around LessTif bugs and deficiencies. If DDD was compiled against LessTif, the default value is the
value of the |
To set the lessTifVersion resource at DDD invocation and
to specify the version number of the LessTif library, you can also use
the option --lesstif-version version.
The default value of the lessTifVersion resource is derived from
the LessTif library DDD was compiled against (or 1000
when compiled against OSF/Motif). Hence, you normally don't need to
worry about the value of this resource. However, if you use a
dynamically linked DDD binary with a library other than the one
DDD was compiled against, you must specify the version number of
the library using this resource. (Unfortunately, DDD cannot
detect this at run-time.)
Here are a few scenarios to illustrate this scheme:
--lesstif-version 88.
--lesstif-version 1000.
--lesstif-version 90.
To find out the LessTif or OSF/Motif version DDD was
compiled against, invoke DDD with the
--configuration option.
In the DDD source, LessTif-specific hacks are controlled by
the string lesstif_version.
Do you miss anything in this manual? Do you have any material that should be added? Please send any contributions to ddd@gnu.org.
If you have any contributions to be incorporated into DDD,
please send them to ddd@gnu.org. For suggestions on what might
be done, see the file TODO in the DDD distribution.
See the DDD WWW page for frequently answered questions not covered in this manual.
Version 2, June 1991
Copyright © 1989, 1991 Free Software Foundation, Inc. 675 Mass Ave, Boston, MA 02111-1307, USA Everyone is permitted to copy and distribute verbatim copies of this license document, but changing it is not allowed.
The licenses for most software are designed to take away your freedom to share and change it. By contrast, the GNU General Public License is intended to guarantee your freedom to share and change free software--to make sure the software is free for all its users. This General Public License applies to most of the Free Software Foundation's software and to any other program whose authors commit to using it. (Some other Free Software Foundation software is covered by the GNU Library General Public License instead.) You can apply it to your programs, too.
When we speak of free software, we are referring to freedom, not price. Our General Public Licenses are designed to make sure that you have the freedom to distribute copies of free software (and charge for this service if you wish), that you receive source code or can get it if you want it, that you can change the software or use pieces of it in new free programs; and that you know you can do these things.
To protect your rights, we need to make restrictions that forbid anyone to deny you these rights or to ask you to surrender the rights. These restrictions translate to certain responsibilities for you if you distribute copies of the software, or if you modify it.
For example, if you distribute copies of such a program, whether gratis or for a fee, you must give the recipients all the rights that you have. You must make sure that they, too, receive or can get the source code. And you must show them these terms so they know their rights.
We protect your rights with two steps: (1) copyright the software, and (2) offer you this license which gives you legal permission to copy, distribute and/or modify the software.
Also, for each author's protection and ours, we want to make certain that everyone understands that there is no warranty for this free software. If the software is modified by someone else and passed on, we want its recipients to know that what they have is not the original, so that any problems introduced by others will not reflect on the original authors' reputations.
Finally, any free program is threatened constantly by software patents. We wish to avoid the danger that redistributors of a free program will individually obtain patent licenses, in effect making the program proprietary. To prevent this, we have made it clear that any patent must be licensed for everyone's free use or not licensed at all.
The precise terms and conditions for copying, distribution and modification follow.
Activities other than copying, distribution and modification are not covered by this License; they are outside its scope. The act of running the Program is not restricted, and the output from the Program is covered only if its contents constitute a work based on the Program (independent of having been made by running the Program). Whether that is true depends on what the Program does.
You may charge a fee for the physical act of transferring a copy, and you may at your option offer warranty protection in exchange for a fee.
These requirements apply to the modified work as a whole. If identifiable sections of that work are not derived from the Program, and can be reasonably considered independent and separate works in themselves, then this License, and its terms, do not apply to those sections when you distribute them as separate works. But when you distribute the same sections as part of a whole which is a work based on the Program, the distribution of the whole must be on the terms of this License, whose permissions for other licensees extend to the entire whole, and thus to each and every part regardless of who wrote it.
Thus, it is not the intent of this section to claim rights or contest your rights to work written entirely by you; rather, the intent is to exercise the right to control the distribution of derivative or collective works based on the Program.
In addition, mere aggregation of another work not based on the Program with the Program (or with a work based on the Program) on a volume of a storage or distribution medium does not bring the other work under the scope of this License.
The source code for a work means the preferred form of the work for making modifications to it. For an executable work, complete source code means all the source code for all modules it contains, plus any associated interface definition files, plus the scripts used to control compilation and installation of the executable. However, as a special exception, the source code distributed need not include anything that is normally distributed (in either source or binary form) with the major components (compiler, kernel, and so on) of the operating system on which the executable runs, unless that component itself accompanies the executable.
If distribution of executable or object code is made by offering access to copy from a designated place, then offering equivalent access to copy the source code from the same place counts as distribution of the source code, even though third parties are not compelled to copy the source along with the object code.
If any portion of this section is held invalid or unenforceable under any particular circumstance, the balance of the section is intended to apply and the section as a whole is intended to apply in other circumstances.
It is not the purpose of this section to induce you to infringe any patents or other property right claims or to contest validity of any such claims; this section has the sole purpose of protecting the integrity of the free software distribution system, which is implemented by public license practices. Many people have made generous contributions to the wide range of software distributed through that system in reliance on consistent application of that system; it is up to the author/donor to decide if he or she is willing to distribute software through any other system and a licensee cannot impose that choice.
This section is intended to make thoroughly clear what is believed to be a consequence of the rest of this License.
Each version is given a distinguishing version number. If the Program specifies a version number of this License which applies to it and "any later version", you have the option of following the terms and conditions either of that version or of any later version published by the Free Software Foundation. If the Program does not specify a version number of this License, you may choose any version ever published by the Free Software Foundation.
If you develop a new program, and you want it to be of the greatest possible use to the public, the best way to achieve this is to make it free software which everyone can redistribute and change under these terms.
To do so, attach the following notices to the program. It is safest to attach them to the start of each source file to most effectively convey the exclusion of warranty; and each file should have at least the "copyright" line and a pointer to where the full notice is found.
one line to give the program's name and an idea of what it does. Copyright (C) 19yy name of author This program is free software; you can redistribute it and/or modify it under the terms of the GNU General Public License as published by the Free Software Foundation; either version 2 of the License, or (at your option) any later version. This program is distributed in the hope that it will be useful, but WITHOUT ANY WARRANTY; without even the implied warranty of MERCHANTABILITY or FITNESS FOR A PARTICULAR PURPOSE. See the GNU General Public License for more details. You should have received a copy of the GNU General Public License along with this program; if not, write to the Free Software Foundation, Inc., 59 Temple Place - Suite 330, Boston, MA 02111-1307, USA.
Also add information on how to contact you by electronic and paper mail.
If the program is interactive, make it output a short notice like this when it starts in an interactive mode:
Gnomovision version 69, Copyright (C) 19yy name of author Gnomovision comes with ABSOLUTELY NO WARRANTY; for details type `show w'. This is free software, and you are welcome to redistribute it under certain conditions; type `show c' for details.
The hypothetical commands show w and show c should show
the appropriate parts of the General Public License. Of course, the
commands you use may be called something other than show w and
show c; they could even be mouse-clicks or menu items--whatever
suits your program.
You should also get your employer (if you work as a programmer) or your school, if any, to sign a "copyright disclaimer" for the program, if necessary. Here is a sample; alter the names:
Yoyodyne, Inc., hereby disclaims all copyright interest in the program `Gnomovision' (which makes passes at compilers) written by James Hacker. signature of Ty Coon, 1 April 1989 Ty Coon, President of Vice
This General Public License does not permit incorporating your program into proprietary programs. If your program is a subroutine library, you may consider it more useful to permit linking proprietary applications with the library. If this is what you want to do, use the GNU Library General Public License instead of this License.
We have set up a mailing list for general DDD discussions. If you need help and assistance for solving a DDD problem, you find the right people here.
Send message to all receivers of the mailing list to:
ddd@gnu.org
This mailing list is also the place where new DDD releases are announced. If you want to subscribe the list, or get more information, send a mail to
ddd-request@gnu.org
See also the DDD WWW page for recent announcements and other news related to DDD.
(): GDB Argument Commands
():: Tool Bar
3-D Lines: Plot Appearance
Abort: Program Menu, Quitting
About DDD: Help Menu
Align on Grid: Data Menu
All Signals: Signals
Apply: GDB Simple Commands, Commands Menu
Attach: Attaching to a Process
Attach to Process: Attaching to a Process, File Menu
Auto-align Displays on Nearest Grid Point: Aligning Displays
Automatic Display of Button Hints: Button tips
Automatic Display of Variable Values: Value Tips
Backtrace: Status Menu
Break: Setting Breakpoints, Tool Bar
Breakpoints: Source Menu
Button: GDB Simple Commands
Cache Machine Code: Customizing Machine Code
Cache source files: Customizing Source Lookup
Change Directory: Working Directory, File Menu
Clear: Disabling Breakpoints, Deleting Breakpoints, Tool Bar, Edit Menu
Clear Line: Commands Menu
Clear Undo Buffer: Customizing Undo
Clear Window: Commands Menu
Close: File Menu
Close data window when deleting last display: Deleting Displays
Cluster: Clustering
Cluster Data Displays: Clustering
Color: Printing the Graph
Command: GDB Simple Commands, Entering Plotting Commands
Command History: Commands Menu
Command Tool: View Menu
Commands: Commands Menu, Menu Bar
Complete: Commands Menu
Cont: Command Tool
Continue: Continuing Somewhere Else, Resuming Execution, Program Menu
Continue Automatically when Mouse Pointer is Frozen: Stopping X Programs
Continue Until Here: Temporary Breakpoints
Continue Without Signal: Signals, Program Menu
Contour: Plot Appearance
Copy: Deleting Displays, Edit Menu
Ctrl+A is: Customizing the Edit Menu
Ctrl+C is: Customizing the Edit Menu
Cut: Deleting Displays, Edit Menu
Data: Data Menu, Menu Bar
Data Scrolling: Scrolling Data
Data Window: View Menu
DBX Console: View Menu
DBX Reference: Getting Help, Help Menu
DBX Settings: Edit Menu
DDD License: Help Menu
DDD News: Help Menu
DDD Reference: Getting Help, Help Menu
DDD Splash Screen: Splash Screen
DDD WWW Page: Getting Help, Help Menu
Debug DDD: Maintenance Menu
Debugger Reference: Getting Help, Help Menu
Debugger Settings: Edit Menu
Debugger Type: Debugger Invocation
Define Command: Commands Menu
Delete: Editing Breakpoint Properties, Deleting Breakpoints, Edit Menu, Deleting Sessions
Delete Breakpoint: Deleting Breakpoints
Detach Process: Attaching to a Process, File Menu
Detect Aliases: Shared Structures, Data Menu
Determine Automatically from Arguments: Debugger Invocation
Disable: Editing Breakpoint Properties, Disabling Breakpoints
Disable Breakpoint: Disabling Breakpoints
Disp *: Dereferencing Pointers
Display: Creating Single Displays, Display Basics, Tool Bar
Display (): Data Menu
Display *: Dereferencing Pointers
Display *(): Dereferencing Pointers
Display Arguments: Displaying Local Variables, Data Menu
Display Line Numbers: Source Menu
Display Local Variables: Displaying Local Variables, Data Menu
Display Machine Code: Source Menu
Display Source Line Numbers: Customizing Source Appearance
Display Two-Dimensional Arrays as Tables: Arrays as Tables
Displays: Data Menu
Do Nothing: Maintenance Menu
Down: Selecting a frame, Command Tool, Status Menu
Dump Core: Maintenance Menu
Dump Core Now: Maintenance Menu
Edit: Editing Source Code, Command Tool, Edit Menu, Menu Bar
Edit <<: GDB Simple Commands
Edit >>: GDB Simple Commands, Breakpoint Commands
Edit Buttons: Defining Buttons, Commands Menu
Edit Menu: Display Shortcuts
Edit Source: Editing Source Code, Source Menu
Edit Sources: Editing Source Code
Enable: Editing Breakpoint Properties, Disabling Breakpoints
Enable Breakpoint: Disabling Breakpoints
Enable supported buttons only: Defining Buttons
End: GDB Simple Commands, Breakpoint Commands
Execution Window: Customizing the Execution Window, View Menu
Exit: File Menu, Quitting
File: File Menu, Menu Bar
File Name: Printing the Graph
Find <<: Textual Search
Find << (): Source Menu
Find >>: Textual Search, Tool Bar
Find >> (): Source Menu
Find Backward: Commands Menu
Find Case Sensitive: Source Menu
Find Forward: Commands Menu
Find Words Only: Textual Search, Source Menu
Finish: Resuming Execution, Command Tool, Program Menu
GDB Console: View Menu
GDB Reference: Getting Help, Help Menu
GDB Settings: Edit Menu
Get Core File: Customizing Sessions
Help: Getting Help, Help Menu, Menu Bar
Hide: Showing and Hiding Details, Tool Bar
Iconify all windows at once: Icons
Ignore Count: Breakpoint Ignore Counts
Include Core Dump: Saving Sessions
Interrupt: Interrupting, Command Tool, Program Menu
JDB Console: View Menu
JDB Reference: Getting Help, Help Menu
JDB Settings: Edit Menu
Kill: Killing the Program, Command Tool, Program Menu
Ladebug Console: View Menu
Ladebug Reference: Getting Help, Help Menu
Ladebug Settings: Edit Menu
Landscape: Printing Plots
Layout Graph: Automatic Layout, Data Menu
List Processes: Attaching to a Process
Lookup: Editing Breakpoint Properties, Looking up Definitions, Tool Bar
Lookup (): Source Menu
Machine Code Indentation: Customizing Machine Code
Machine Code Window: View Menu
Maintenance: Maintenance Menu, Menu Bar
Make: Recompiling, Command Tool, File Menu
Memory: Examining Memory, Data Menu
New Display: Display Shortcuts
New Game: Maintenance Menu
Next: Resuming Execution, Command Tool, Commands Menu, Program Menu
Next Instruction: Machine Code Execution, Program Menu
Nexti: Machine Code Execution, Command Tool
On item: Help Menu
Open: Opening Source Files, Opening Core Dumps, Opening Programs
Open Class: Opening Programs, File Menu
Open Core Dump: File Menu
Open Program: Attaching to a Process, Opening Programs, File Menu
Open Recent: Opening Programs, File Menu
Open Session: File Menu, Resuming Sessions
Open Source: Opening Source Files, File Menu
Orientation: Printing the Graph
Other: Display Shortcuts
Overview: Help Menu
Paper Size: Printing Plots, Printing the Graph
Pass: Signals
Paste: Deleting Displays, Edit Menu
Perl Console: View Menu
Perl Reference: Getting Help, Help Menu
Perl Settings: Edit Menu
Plot: Gnuplot Invocation, Plot Appearance, Tool Bar
Plot Window: Gnuplot Invocation
Portrait: Printing Plots
Preferences: Edit Menu
Previous: Commands Menu
Print: Printing Values, Signals, Editing all Watchpoints, Editing Watchpoint Properties, Tool Bar
Print (): Data Menu
Print Command: Printing the Graph
Print Graph: Printing the Graph, File Menu
Print Plot: Printing Plots
Program: Program Menu, Menu Bar
PYDB Console: View Menu
PYDB Reference: Getting Help, Help Menu
PYDB Settings: Edit Menu
Quit Search: Commands Menu
Record: GDB Simple Commands, Breakpoint Commands
Redo: Undoing Program Execution, Looking up Previous Locations, Undo and Redo, Command Tool, Edit Menu
Refer to Program Sources: Customizing Source Lookup
Refresh: Data Menu
Refresh Displays: Repeated Values, Refreshing the Data Window
Registers: Registers, Status Menu
Reload Source: Editing Source Code, Source Menu
Remove Menu: Maintenance Menu
Reset: Signals
Restart: File Menu
Rotate: Tool Bar
Rotate Graph: Rotating the Graph, Data Menu
Run: Starting Program Execution, Command Tool, Program Menu
Run Again: Starting Program Execution, Program Menu
Run in Execution Window: Using the Execution Window, Program Menu
Save Data As: Exporting Plot Data
Save Options: Signals, Edit Menu
Save Session As: Signals, File Menu, Saving Sessions
Scale: Plot Appearance
Search path for source files: Source Path
Select All: Edit Menu
Selected Only: Printing Plots, Printing the Graph
Send: Signals
Set: Assignment, Tool Bar
Set Execution Position: Continuing Somewhere Else
Set Temporary Breakpoint: Temporary Breakpoints
Set Value: Assignment
Show: Showing and Hiding Details, Tool Bar
Show All: Showing and Hiding Details
Show Just: Showing and Hiding Details
Show More: Showing and Hiding Details
Show Position and Breakpoints: Customizing Glyphs
Signals: Signals, Status Menu
Source: Source Menu, Menu Bar
Source indentation: Customizing Source Appearance
Source Window: View Menu
Status: Status Menu, Menu Bar
Status Displays: Displaying Program Status, Data Menu
Step: Resuming Execution, Command Tool, Program Menu
Step Instruction: Machine Code Execution, Program Menu
Stepi: Machine Code Execution, Command Tool
Stop: Signals
Suppress X warnings: X Warnings
Tab Width: Customizing Source Appearance
Temp: Editing Breakpoint Properties
Threads: Threads, Status Menu
Threshold for repeated print elements: Repeated Values
Tic Tac Toe: Maintenance Menu
Tip of the Day: Help Menu
Tool Bar Appearance: Window Layout
Tool Buttons Location: Disabling the Command Tool
Uncluster: Clustering
Uncompress: Help Helpers
Undisp: Deleting Displays, Tool Bar
Undisplay: Display Basics
Undo: Deleting Displays, Showing and Hiding Details, Undoing Program Execution, Selecting a frame, Looking up Previous Locations, Undo and Redo, Command Tool, Edit Menu
Undo Buffer Size: Customizing Undo
Uniconify When Ready: Program Stop
Until: Resuming Execution, Command Tool, Program Menu
Unwatch: Tool Bar
Up: Selecting a frame, Command Tool, Status Menu
View: Plot Appearance, View Menu, Menu Bar
Warn if Multiple DDD Instances are Running: Multiple Instances
Watch: Editing Watchpoint Properties, Setting Watchpoints, Tool Bar
Watchpoints: Data Menu
Web Browser: Help Helpers
What Now?: Getting Help, Help Menu
When DDD Crashes: Maintenance Menu
Window Layout: Window Layout
Writing into executable and core files: Patching
XDB Console: View Menu
XDB Reference: Getting Help, Help Menu
XDB Settings: Edit Menu
Ctrl+\: Quitting
Ctrl+B: Command History
Ctrl+C: Interrupting, Customizing the Edit Menu, Quitting
Ctrl+D: Quitting
Ctrl+Down: Selecting a frame
Ctrl+F: Command History
Ctrl+F1: Getting Help
Ctrl+Q: Quitting, Invocation
Ctrl+Shift+A: Customizing the Edit Menu
Ctrl+Up: Selecting a frame
Down: Command History, Moving Displays, Selecting Displays
ESC: Command History, Interrupting, Customizing the Edit Menu, Quitting
F1: Getting Help
Home: Customizing the Edit Menu
Left: Moving Displays, Selecting Displays
Return: Command History
Right: Moving Displays, Selecting Displays
Shift: Selecting Displays
TAB: Tool Bar
Up: Command History, Moving Displays, Selecting Displays
cont: Undoing Program Execution, Customizing Grab Checking
contuntil: GDB Argument Commands
directory: Source Path
down: Selecting a frame
file: Remote Program
gcore: Customizing Sessions
gd: Commands with Other Debuggers
graph disable display: Showing and Hiding Details
graph display: Displaying Program Status, Creating Single Displays
graph enable display: Showing and Hiding Details
graph plot: Plotting Arrays
graph refresh: Refreshing the Data Window
gunzip: Help Helpers
gzip: Help Helpers
hbreak: Hardware-Assisted Breakpoints
help: Getting Help
kill: Customizing Grab Checking
mwm: Gnuplot Invocation
print: Printing Values
quit: Customizing Grab Checking, Quitting
remsh: Remote Debugger
replot: Entering Plotting Commands
rsh: Remote Debugger
run: Starting Program Execution
set environment: Environment
set output: Entering Plotting Commands
set term: Entering Plotting Commands
target remote: Remote Program
thbreak: Hardware-Assisted Breakpoints
tty: Debugger Communication
unset environment: Environment
up: Selecting a frame
zcat: Help Helpers
activeButtonColorKey: Customizing the Tool Bar
align2dArrays: Arrays as Tables
appDefaultsVersion: Customizing Diagnostics
arrayOrientation: Rotating Displays
autoCloseDataWindow: Customizing Displays
autoDebugger: Debugger Invocation
autoRaiseMenu: Auto-Raise Menus
autoRaiseMenuDelay: Auto-Raise Menus
autoRaiseTool: Customizing Tool Position
blockTTYInput: Debugger Communication
break_at: Images
bumpDisplays: Customizing Displays
buttonCaptionGeometry: Customizing the Tool Bar
buttonCaptions: Customizing the Tool Bar
buttonColorKey: Customizing the Tool Bar
buttonDocs: Button tips
buttonImageGeometry: Customizing the Tool Bar
buttonImages: Customizing the Tool Bar
buttonTips: Button tips
cacheGlyphImages: Customizing Glyphs
cacheMachineCode: Customizing Machine Code
cacheSourceFiles: Customizing Source Lookup
checkConfiguration: Customizing Diagnostics
checkGrabDelay: Customizing Grab Checking
checkGrabs: Customizing Grab Checking
checkOptions: Multiple Instances
CLASSPATH: Source Path
clear_at: Images
clusterDisplays: Customizing Displays
commandToolBar: Disabling the Command Tool
commonToolBar: Window Layout
consoleButtons: Customizing Buttons
cutCopyPasteBindings: Customizing the Edit Menu
dataButtons: Customizing Buttons
dbxDisplayShortcuts: Display Shortcuts
dbxInitCommands: DBX Initialization
dbxSettings: DBX Initialization
ddd: Images
DDD: Environment
DDD_NO_SIGNAL_HANDLERS: Debugging DDD
DDD_SESSION: Resources
DDD_SESSIONS: Customizing Sessions
DDD_STATE: Resources
dddinitVersion: Customizing Diagnostics
debugCoreDumps: Customizing Diagnostics
debugger: Debugger Invocation
debuggerCommand: Debugger Invocation
decorateTool: Customizing Tool Decoration
defaultFont: Customizing Fonts
defaultFontSize: Customizing Fonts
delete: Images
deleteAliasDisplays: Shared Structures
detectAliases: Shared Structures
disable: Images
disassemble: Customizing Machine Code
display: Images
DISPLAY: Remote Host, X Options
displayGlyphs: Customizing Glyphs
displayLineNumbers: Customizing Source Appearance
displayTimeout: Debugger Communication
dispref: Images
drag_arrow: Images
drag_cond: Images
drag_stop: Images
drag_temp: Images
dumpCore: Customizing Diagnostics
editCommand: Customizing Editing
EDITOR: Customizing Editing
enable: Images
expandRepeatedValues: Repeated Values
filterFiles: Customizing File Filtering
find_backward: Images
find_forward: Images
findCaseSensitive: Customizing Searching
findWordsOnly: Customizing Searching
fixedWidthFont: Customizing Fonts
fixedWidthFontSize: Customizing Fonts
flatDialogButtons: Customizing the Tool Bar
flatToolbarButtons: Customizing the Tool Bar
fontSelectCommand: Customizing Fonts
gdbDisplayShortcuts: Display Shortcuts
gdbInitCommands: GDB Initialization
gdbSettings: GDB Initialization
getCoreCommand: Customizing Sessions
globalTabCompletion: Command Completion
glyphUpdateDelay: Customizing Glyphs
grabAction: Customizing Grab Checking
grabActionDelay: Customizing Grab Checking
grey_arrow: Images
grey_cond: Images
grey_stop: Images
grey_temp: Images
groupIconify: Icons
hide: Images
hideInactiveDisplays: Customizing Displays
indentCode: Customizing Machine Code
indentScript: Customizing Source Appearance
indentSource: Customizing Source Appearance
jdbDisplayShortcuts: Display Shortcuts
jdbInitCommands: JDB Initialization
jdbSettings: JDB Initialization
labelDelimiter: Customizing Buttons
lessTifVersion: LessTif
lineBufferedConsole: Input/Output
lineNumberWidth: Customizing Source Appearance
linesAboveCursor: Customizing Source Scrolling
linesBelowCursor: Customizing Source Scrolling
listCoreCommand: Customizing Remote Debugging
listDirCommand: Customizing Remote Debugging
listExecCommand: Customizing Remote Debugging
listSourceCommand: Customizing Remote Debugging
lookup: Images
maintenance: Customizing Diagnostics
maketemp: Images
maxDisassemble: Customizing Machine Code
maxGlyphs: Customizing Glyphs
maxUndoDepth: Customizing Undo
maxUndoSize: Customizing Undo
new_break: Images
new_display: Images
new_watch: Images
openDataWindow: Toggling Windows
openDebuggerConsole: Toggling Windows
openSelection: Opening the Selection
openSourceWindow: Toggling Windows
PAGER: Customizing Diagnostics, Environment
pannedGraphEditor: Scrolling Data
paperSize: Printing the Graph
perlDisplayShortcuts: Display Shortcuts
perlInitCommands: Perl Initialization
perlSettings: Perl Initialization
plain_arrow: Images
plain_cond: Images
plain_stop: Images
plain_temp: Images
plot2dSettings: Gnuplot Settings
plot3dSettings: Gnuplot Settings
plotCommand: Gnuplot Invocation
plotInitCommands: Gnuplot Settings
plotTermType: Gnuplot Invocation
plotWindowClass: Gnuplot Invocation
plotWindowDelay: Gnuplot Invocation
popdownHistorySize: Text Fields
positionTimeout: Debugger Communication
print: Images
printCommand: Printing the Graph
properties: Images
psCommand: Customizing Attaching to Processes
pydbDisplayShortcuts: Display Shortcuts
pydbInitCommands: PYDB Initialization
pydbSettings: PYDB Initialization
questionTimeout: Debugger Communication
rotate: Images
rshCommand: Customizing Remote Debugging
saveHistoryOnExit: Command History
selectAllBindings: Customizing the Edit Menu
separateDataWindow: Window Layout
separateExecWindow: Customizing the Execution Window
separateSourceWindow: Window Layout
set: Images
SHELL: Arguments
show: Images
showBaseDisplayTitles: Customizing Displays
showConfiguration: Customizing Diagnostics
showDependentDisplayTitles: Customizing Displays
showFonts: Customizing Diagnostics
showInvocation: Customizing Diagnostics
showLicense: Customizing Diagnostics
showManual: Customizing Diagnostics
showMemberNames: Rotating Displays
showNews: Customizing Diagnostics
showVersion: Customizing Diagnostics
signal_arrow: Images
sortPopdownHistory: Text Fields
sourceButtons: Customizing Buttons
sourceEditing: In-Place Editing
sourceInitCommands: GDB Initialization
splashScreen: Splash Screen
splashScreenColorKey: Splash Screen
startupTipCount: Tip of the day
startupTips: Tip of the day
statusAtBottom: Window Layout
stickyTool: Customizing Tool Position
structOrientation: Rotating Displays
suppressWarnings: Customizing Diagnostics, X Warnings
synchronousDebugger: Debugger Communication
tabWidth: Customizing Source Appearance
TERM: Customizing the Execution Window, Environment
TERMCAP: Environment
termCommand: Customizing the Execution Window
terminateOnEOF: Debugger Communication
termType: Customizing the Execution Window
tip: Tip of the day
toolbarsAtBottom: Window Layout
toolButtons: Customizing Buttons
toolRightOffset: Customizing Tool Position
toolTopOffset: Customizing Tool Position
trace: Customizing Diagnostics
typedAliases: Shared Structures
uncompressCommand: Help Helpers
undisplay: Images
uniconifyWhenReady: Icons
unwatch: Images
useSourcePath: Customizing Source Lookup
useTTYCommand: Debugger Communication
valueDocs: Value Tips
valueTips: Value Tips
variableWidthFont: Customizing Fonts
variableWidthFontSize: Customizing Fonts
verifyButtons: Customizing Buttons
vslBaseDefs: Customizing Display Appearance
vslDefs: Customizing Display Appearance
vslLibrary: Customizing Display Appearance
vslPath: Customizing Display Appearance
warnIfLocked: Multiple Instances
watch: Images
WWWBROWSER: Help Helpers
wwwCommand: Help Helpers
wwwPage: Help Helpers
xdbDisplayShortcuts: Display Shortcuts
xdbInitCommands: XDB Initialization
xdbSettings: XDB Initialization
XEDITOR: Customizing Editing
.emacs: Integrating DDD
.gdbinit: Debugging DDD, Remote Program, GDB Options
ChangeLog: Contributors
dbx: Options
Ddd: Application Defaults, More Customizations, Resources
ddd-3.2-html-manual.tar.gz: About this Manual
ddd-3.2-pics.tar.gz: About this Manual
ddd-3.2.tar.gz: About this Manual
ddd-version-html-manual.tar.gz: Getting DDD
ddd-version-pics.tar.gz: Getting DDD
ddd-version.tar.gz: Getting DDD
emacs: Integrating DDD, Customizing Editing, Help Helpers
emacsclient: Customizing Editing
emacsserver: Customizing Editing
fig2dev: Printing the Graph
file: Customizing Remote Debugging
gdb: Options
gdbserver: Remote Program
gnuclient: Customizing Editing
gnuplot: Plot Appearance
gnuserv: Customizing Editing
init: Resources
java.prof: JDB Options
jdb: Options
ladebug: Options
less: Customizing Diagnostics
log: Logging, Entering Plotting Commands, Options
lynx: Help Helpers
make: Recompiling
more: Customizing Diagnostics
mosaic: Help Helpers
mozilla: Help Helpers
netscape: Help Helpers
on: Customizing Remote Debugging
perl: Options
ps: Customizing Attaching to Processes
pydb: Options
remsh: Customizing Remote Debugging
rsh: Customizing Remote Debugging
sample: Sample Session
sample.c: Sample Program, Sample Session
sessions: Customizing Sessions
ssh: Customizing Remote Debugging
stty: Input/Output
TODO: Contributors
transfig: Printing the Graph
vi: Customizing Editing
xdb: Options
xemacs: Integrating DDD, Customizing Editing
xfig: Printing the Graph
xfontsel: Customizing Fonts
xmgr: Exporting Plot Data
xsm: Resuming Sessions
xterm: Customizing the Execution Window
xxgdb: Integrating DDD
~: Resources, Options
Show/Hide: Tool Bar
Display: Tool Bar
Print: Tool Bar
Rotate: Tool Bar
Find >>: Tool Bar
Set: Tool Bar
Display: Tool Bar
Plot: Tool Bar
Print: Tool Bar
Set: Tool Bar
Within DDD (and this manual), Ladebug is considered a DBX variant. Hence, everything said for DBX also applies to Ladebug, unless stated otherwise.
XDB will no longer be maintained in future DDD releases. Use a recent GDB version instead.
Actual numbers and behavior on your system may vary.
Re-invoke DDD with
--gdb, if you do not see a (gdb) prompt here
(see Choosing an Inferior Debugger)
Only if a core file is included.
If a core file is not to be included in the session, DDD data displays are saved as deferred; that is, they will be restored as soon as program execution reaches the scope in which they were created. See Creating Single Displays, for details.
Requires X11R6 or later.
If
you use a Ddd application-defaults file, you will not be
able to maintain multiple DDD versions at the same time. This
is why the suiting Ddd is normally compiled into the
DDD executable.
If you use DDD to debug Perl or Python scripts, then this section does not apply.
With XDB and some DBX variants, the debugged program must be specified upon invocation and cannot be changed at run time.
JDB, PYDB, and Perl do not support core dumps.
JDB does not support breakpoint disabling.
JDB does not support temporary breakpoints.
GDB has no way to make a temporary breakpoint non-temporary again.
JDB, Perl and some DBX variants do not support breakpoint ignore counts.
JDB, PYDB, and some DBX variants do not support breakpoint commands.
When glyphs are disabled (see Customizing Source), breakpoints cannot be dragged. Delete and set breakpoints instead.
Watchpoints are available in GDB and some DBX variants only. In XDB, a similar feature is available via XDB assertions; see the XDB documentation for details.
If <Ctrl+C> is not bound to
Copy (see Customizing the Edit Menu), you can also use
<Ctrl+C> to interrupt the running program.
If the debuggee runs in a separate
execution window, the debuggee's TERM value is set according to
the termType resource; See Customizing the Execution Window,
for details.
The execution window is not available in JDB.
JDB, PYDB, and Perl do not support attaching the debugger to running processes.
JDB, PYDB, and Perl do not support altering the execution position.
When glyphs are disabled (see Customizing Source), dragging the execution position is not possible. Set the execution position explicitly instead.
Perl does not allow changing the current stack frame.
Currently, threads are supported in GDB and JDB only.
This requires that the full array size is known to the debugger.
JDB does not support changing variable values.
The string //; can
be changed via the labelDelimiter resource. See Customizing Buttons, for details.
valign() is similar to
halign(), but builds a vertical alignment.
The machine code window is available with GDB only.
The machine code window is available with GDB and some DBX variants only.
If you use DDD commands within command definitions, or if you include debugger commands that resume execution, these commands will be realized transparently as auto-commands--that is, they won't be executed directly by the inferior debugger, but result in a command string being sent to DDD. This command string is then interpreted by DDD and sent back to the inferior debugger, possibly prefixed by some other commands such that DDD can update its state. See Commands with Other Debuggers, for a discussion.
Since the inferior debugger is invoked through a virtual TTY, standard error is normally redirected to standard output, so DDD never receives standard error from the inferior debugger.